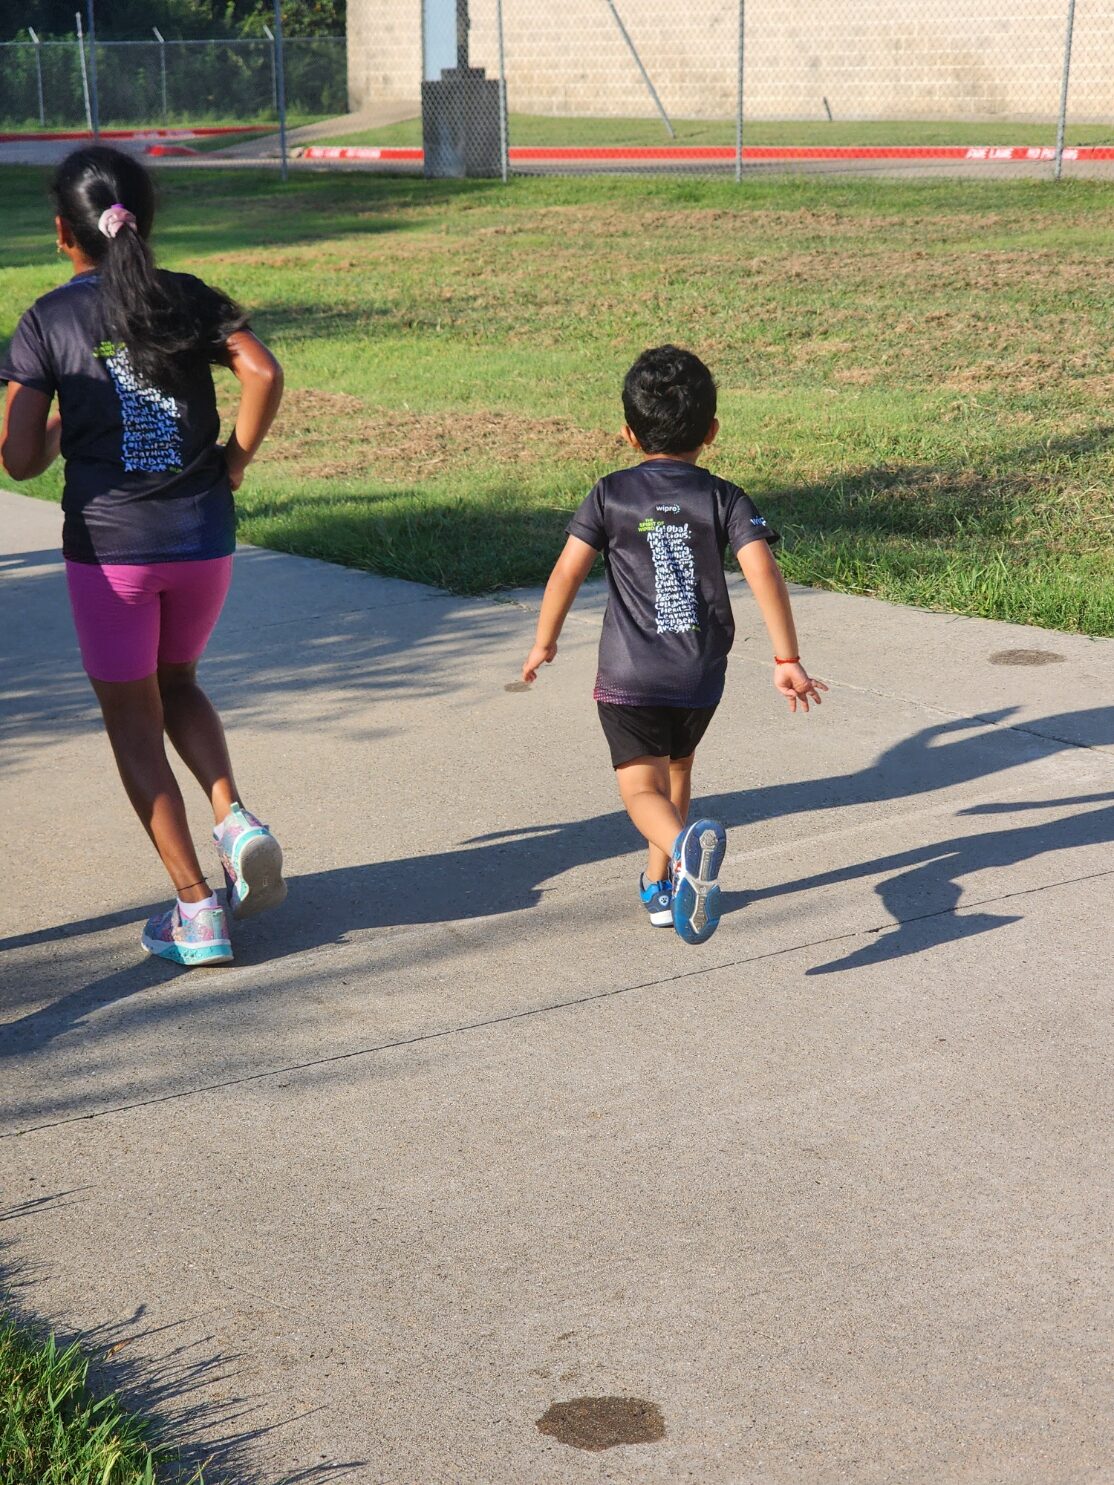
Picture this: the familiar thud of my shoes on pavement, and breath syncing with each stride. For the last few years, running has been my sanctuary; a place where pacing, rhythm, and focus reign supreme. Half-marathons, 15Ks and 10Ks all followed a predictable dance (a test of linear endurance). You plan your splits, find your groove, and push through the mental fog. Then I signed up for my first Spartan 5K, an obstacle course race that laughed in the face of everything I’d learned. Mud, walls, rope climb and sheer chaos flipped my running world upside down. Was it a one-off thrill, or the start of a new obsession? Let’s unpack this wild one a bit.
“I didn’t realize it then, but this shift from predictability to chaos would mirror the very transformation many organizations are facing today.”
The comfort of the known path: The Marathon Mindset
If you’ve followed my blog (Marathon Diary), you know my running journey has been a masterclass in Pacing, Rhythm, and Focus. Of course, proper nutrition, hydration, and training, and you’ve got a formula for crossing finish lines and setting PR’s now and then. In a nutshell, every disciplined runner (and strategist) eventually learns this triad:
Pacing (resource management): This is the strategic budgeting of energy, ensuring no burnout before the final stretch. It’s the disciplined execution of a long-term business plan. Spread it wisely over kms/miles to avoid crashing.
Rhythm (Process Consistency): The steady cadence of breath and stride creating a meditative, predictable workflow. It’s the commitment to established, repeatable processes for consistent delivery.
Focus (Monotony Resilience): The mental battle against laziness and fatigue is about single-minded dedication to a long-term goal. It’s the drive to push past inertia when work feels routine. You wrestle with your mind, pushing past the voice begging you to stop.
Success is largely determined by meticulous planning, hydration, nutrition, and the ability to maintain a steady state in traditional running. It is predictable, controlled, and deeply satisfying at the end. It’s a test of endurance, where you master your body and mind over long, unbroken stretches. Or so I thought! until the Spartan 5K came calling.
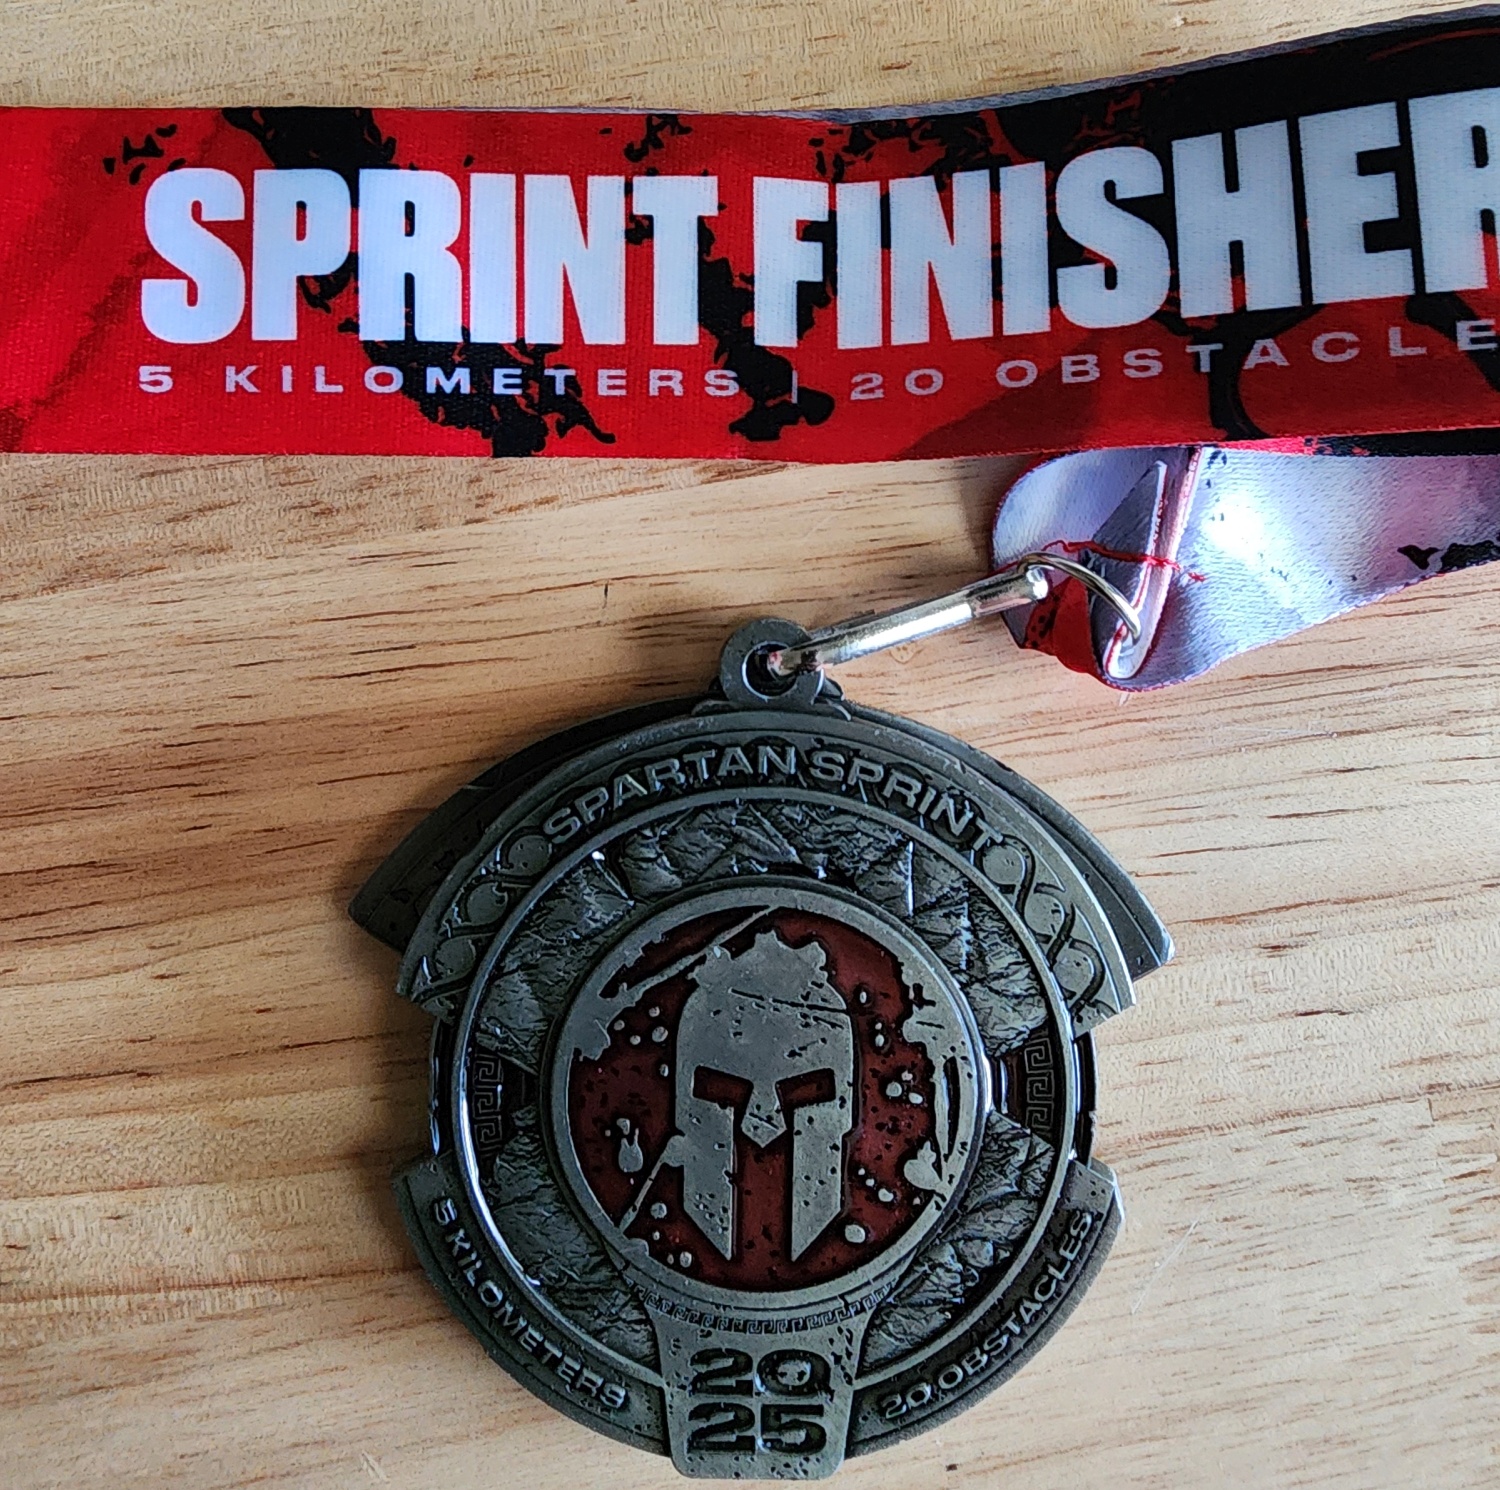
Spartan 5K: Chaos as the New Constant
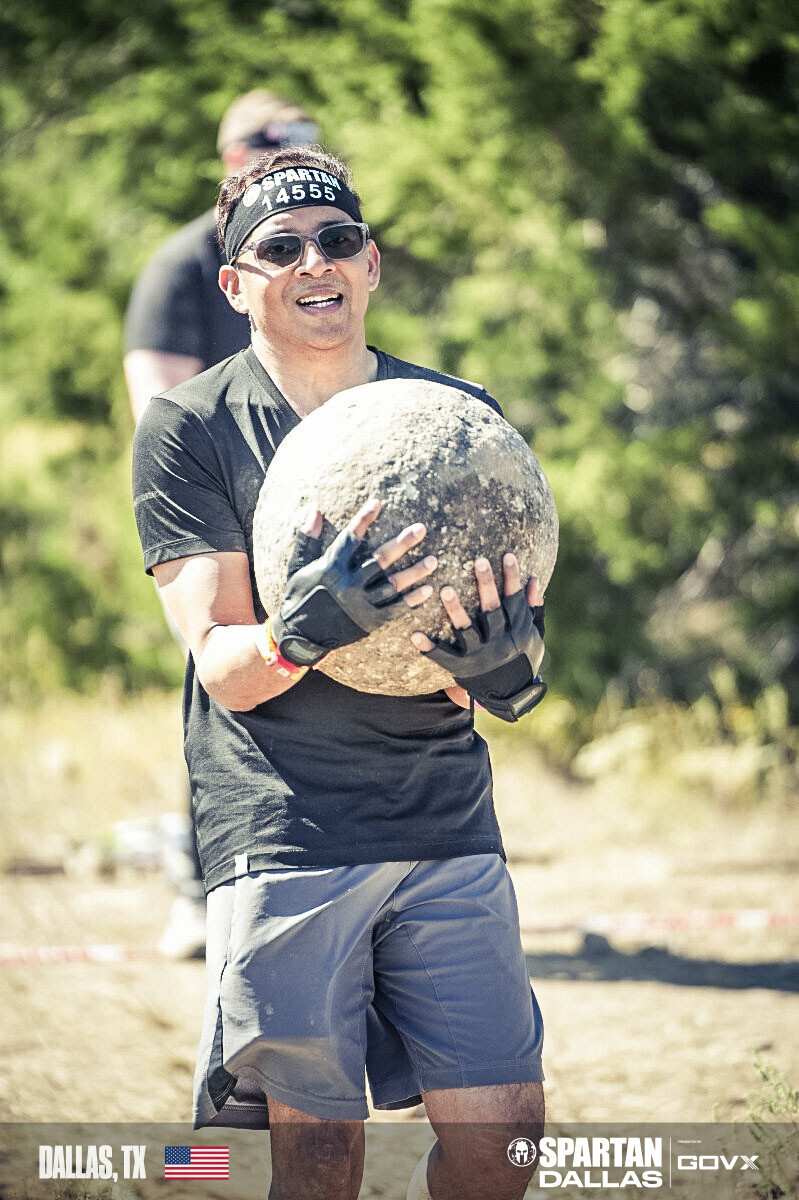
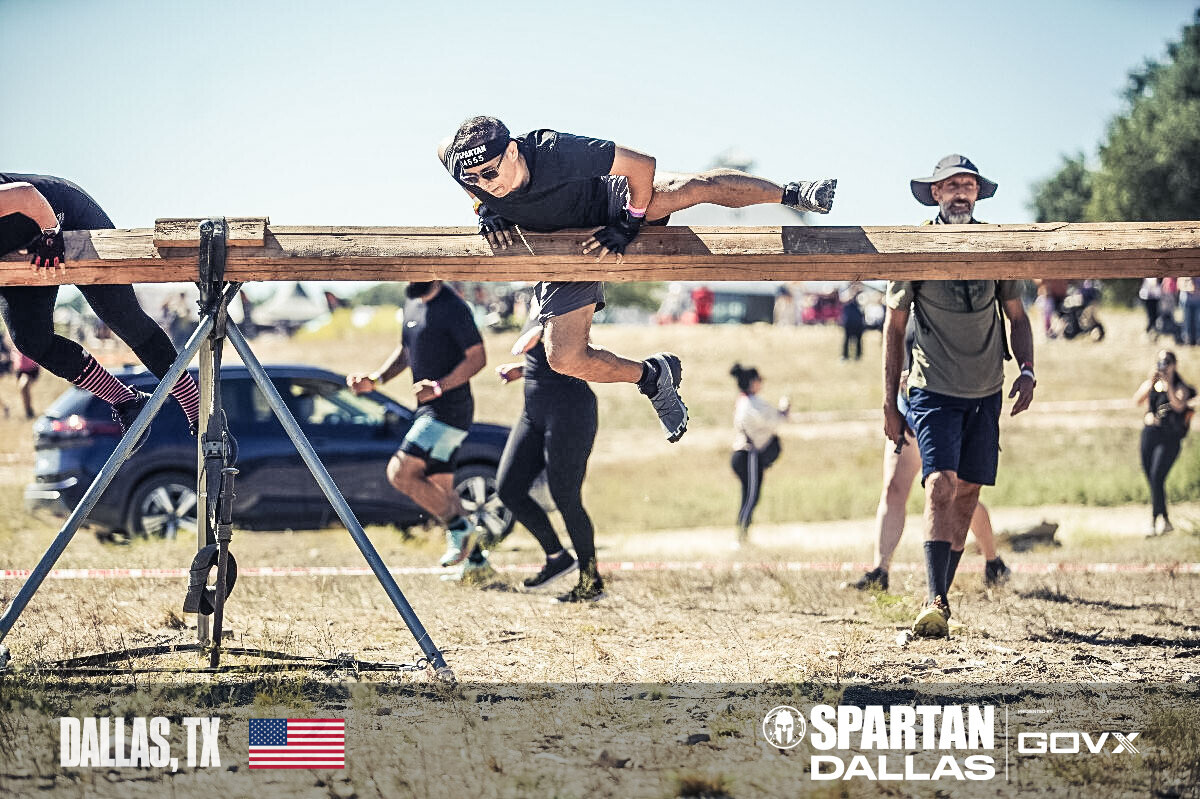
The Spartan 5K was less a race and more a rapid-fire series of high-stakes, high-impact challenges. From the starting line, the routine vanished, replaced by a need for immediate adaptation: a six-foot wall requiring upper-body power, followed by a low crawl under barbed wire demanding immediate shifts in locomotion. Obstacles like rope climbs and the bucket carry transformed a cardio challenge into an integrated test of strength, agility, and grit.
This wasn’t about finding a rhythm; it was about constant disruption and real-time problem-solving. It struck me how much this mirrored what I see in the Retail-CPG sector today where disruption, consumer shifts, and AI-driven competition have turned once-stable playbooks into obstacle courses.
The Agility Shift: Moving from Pacing to Power Bursts
The Spartan 5K forced a paradigm shift in how I viewed strategy and execution. From Endurance to Agility, the three shifts:
Pacing → Power Bursts: My marathon strategy of calculated splits was useless. Success was measured in sprints to an obstacle, maximum-effort bursts to clear it, and on-the-fly recovery before the next challenge. This mirrors the need for modern professionals to transition from slow, linear projects to rapid sprints and intense periods of deep work.
Rhythm → Interruption Resilience: The steady flow was deliberately broken by obstacles. My heart rate and muscle recruitment spiked and dropped repeatedly. The lesson: the capacity to perform, recover quickly, and adapt to the next interruption is more valuable than maintaining an unbroken groove.
Focus → Split-Second Problem-Solving: The focus shifted from enduring monotony to immediate risk assessment (like the height of the rope climb). It demanded a different kind of mental resilience given the zero practice and tricks. The ability to observe how others do the rope climb and execute under pressure, not just push through fatigue is another level.
Crossing that finish line felt different from any road race victory I have experienced. It had nothing to do with time; it was a testament to raw agility and the collaborative spirit forged in the struggle. In today’s market, endurance still matters, but agility wins the race.
The Crossroads: Rhythm vs. AI-gility
“We’re now entering an age of AI-gility — where both human adaptability and AI-assisted speed define success.”
My journey is now at a fascinating crossroads. My personal blog is full of stories about pursuing PRs (Personal Records) and the meticulous planning of road running. But the Spartan experience suggests a deeper truth: strategy must be agile. It raises a question relevant to any career, industry or business:
Do we perfect the single, linear path we know, or do we seek out disruptive challenges that force us to develop new layers of strength and resilience?
Your Turn: Join the Conversation
I’m turning to my professional network for insights.
AI-gility in Action: Have you encountered obstacles where a project or market movement completely disrupted your plans/workflow and forced you to pivot? How did you adapt your strategy in the ‘Spartan moment’?
The Trifecta Dare: Should I commit to the Spartan Trifecta next year, blending my established endurance training with a year dedicated to high-agility, high-strength challenges?
Drop your stories and thoughts in the comment. Your input might just push me toward my next, muddy, adventure.
“McKinsey research finds that agile organizations outperform non-agile peers by 30% in operational performance.”
For years, Consent Management Platforms (CMPs) like OneTrust, TrustArc, and Osano served as the digital privacy gatekeepers of the web. They helped companies display those now-ubiquitous cookie popups and ensure that users gave (or didn’t give) permission for tracking. But while technically necessary for GDPR, CCPA, and similar regulations, CMPs have become more of a compliance checkbox than a meaningful privacy safeguard. We, as users, feel the frustrations of this broken process. Thanks to the evolution of AI and digital experiences, this model is changing.
The Problem: Consent Management Is Fragmented, Fatiguing, and Fading
With AI-first browsers like Comet (to be launched by Perplexity) explicitly designed to “track everything users do online” for hyper-personalized experiences,the locus of control is moving away from individual websites to the browser layer, where consent could be set once and respected everywhere.
In short, Browsers — not websites — are becoming the central actors in user data collection. This shift renders traditional CMPs increasingly irrelevant — unless they evolve.
AI Browsers Don’t Just Observe — They Act!
The implication: CMPs must become smarter or “agent-aware”. They’ll need to integrate directly with browsers and their APIs to:
Interpret global consent settings issued by users.
Detect when AI agents are scraping or collecting data.
Ensure downstream systems (like adtech or analytics platforms) respect those browser-level preferences.
Figure 1: Consent management flow – Today
This isn’t hypothetical. OneTrust and BigID are already deploying AI-driven privacy agents and compliance automation tools, which could evolve to interface directly with browser AI.
Programmable & Portable Consent
Imagine a future where users set privacy preferences once — during browser setup — and those settings follow across every site, platform, and digital touchpoint. That’s programmable consent.
In this model:
CMPs don’t just ask for consent; they interpret and enforce it.
Consent signals become machine-readable, portable, and actionable across systems/devices.
Privacy becomes not a moment in time, but a persistent layer of the digital experience.
Figure 2: Consent management flow – Tomorrow
This requires a fundamental re-architecture of CMPs — from UI overlays to backend orchestration engines.
The existing setup is not going to go away anytime soon. They will co-exist for a while, but the additional layer to address the emergence of AI browsers is inevitable in the near term.
The initial rollout of consent management at the browser level might be rigid or with limited options, but with subsequent rollouts, this could change. For example, browsers could provide options to set consent at website level, website category level, bookmarked/favorite sites level, or as simple as allowing websites to push their ubiquitous popups when a site is opened for the first time on the AI-browser and store the user preference for future visits on the browser.
Blueprint for CMP 2.0: Consent Engineering in Action
CMPs face an urgent need to redefine their value. Instead of focusing solely on front-end banners, they must shift toward being Consent Orchestration Engines or Consent Engineering Platforms —interpreting, enforcing, and governing consent across platforms, applications, and back-end data systems.
Few key opportunities and imperatives for CMPs:
§ Agent-aware and API-first with AI-Browsers
Consent signals will originate from browsers and autonomous agents. CMPs must build real-time API hooks to sync with browser preferences and ensure websites respect those choices.
§ Orchestration Across Platforms
CMPs must manage (and synchronize) machine-readable consent across all digital touchpoints (e.g., website, mobile app, SaaS tools), not just the web layer. Encoding consent in standardized formats (e.g., Global Privacy Control (GPC)) that downstream systems can interpret and enforce automatically is critical.
§ Consent-as-a-Service
Offer “consent-as-a-service” embedded at the edge (e.g., browser extensions, SDKs) to enforce rules downstream—in data warehouses, CDPs, marketing clouds.
§ Downstream Data Governance
It’s not just about capture—it’s about ensuring consent follows the data. I.e., data flow control, compliance logging, and privacy auditing for server-side and AI-powered data operations. CMPs must enforce usage restrictions in analytics, personalization, and advertising systems.
§ Consent Auditing & Logging (PrivacyOps)
Regulators want proof. CMPs can provide the audit layer for browser-generated preferences, creating reconciliations between user intent and system behavior. Deploy AI to detect tracking violations, scan for third-party risks, and auto-generate regulatory reports. Where applicable, collaborate with cloud providers or AI agents to enforce preferences.
Who’s Leading the Way?
Leading CMPs are taking steps to adapt to this new future. For example, there is a lot of investment in AI governance and automation by OneTrust. Use of AI/ML for consent management by BigID and so on.
These companies aren’t just reacting—they’re re-architecting.
What This Means for Privacy Leaders and Digital Teams
We’re at the beginning of a major shift. AI browsers will rewrite the rules of data privacy, and businesses that rely on outdated CMPs risk being caught flat-footed. Hence, the implications of this browser-centric future are profound:
Chief Privacy Officers must start redefining what compliance looks like when consent is programmable and portable.
Marketing and data teams need to reconfigure how they ingest and process user data—browser signals might override what your CRM thinks it knows.
Engineering teams must build consent-aware architectures that support API-driven orchestration and server-side governance.
In short, the cookie banner era is ending. The age of dynamic, portable, agent-aware consent is here. It is time for you to:
Audit your current CMP for readiness in an AI-agent web environment.
Evaluate browser-level consent initiatives and their implications for your data strategy.
Explore integration paths between your privacy stack and AI/automation tools.
Are these thoughts in your mind?
How to evaluate your consent architecture for the AI browser era?
Is your CMP strategy AI-agent ready?
Should your next privacy investment be in compliance… or consent engineering?
Don’t get left behind. Reach out, and let’s collaborate on building a forward-thinking approach to consent that aligns with the browser-level revolution.
A Strategic Perspective on the Implications of AI-Powered Browsers
“AI-Augmented”, “AI-Powered”, and “AI-First” browsers are more than just a technology trend—they represent a new digital operating system for businesses and consumers. Browsers like Arc, Zen, and others will fundamentally reshape how consumers discover, engage with, and stay loyal to brands.
This transformation will be most profoundly felt by Retail and Consumer Packaged Goods (CPG) firms, where the brand and product experience lies at the core of consumer engagement. The browser is no longer just a window to the internet—it’s the new gateway to experience. From my testing of the Arc browser, to Perplexity’s plans for a tracking-based AI browser for selling hyper-personalized ads, to OpenAI and Yahoo’s intent to acquire Chrome, it’s clear that the browser landscape is undergoing a tectonic shift.
At the heart of this shift lies the integration of AI, enabling personalization without compromising privacy, and dynamically capturing user context to drive tailored interactions. This demands a significant re-evaluation of existing digital strategies and may require redesigning brand/product portals. Early adopters will define the next wave of brand leadership, consumer trust, and loyalty.
The future of browsing is not “browsing” at all — it’s experiencing, understanding, and executing.
The real question for CxOs is no longer “Should we prepare?” — it is “How quickly can we adapt?”
Key Strategic Imperatives for Retail and CPG Firms
1. Rethinking Search, Discovery, and Product Data Design
Move from keyword-based to intent-driven search. Implement semantic HTML tags and structured data (e.g., Schema.org) to ensure AI systems can understand context, content, and functionality such as checkout, FAQs, or form fills.
For example: “Show me sustainably built, highly-rated daily trainer Nike shoes with a 4–8mm drop, no break-in time, and available for same-day delivery near me.”
Only brands with well-structured, attribute-rich product data will win these high-intent micro-moments.
Strategic Action: Ensure product catalogs are richly detailed, semantically tagged, and discoverable via AI-native techniques (Schema.org, OpenGraph, etc.).
2. True Hyper-Personalized Shopping Experiences
Retailers must shift from segments to individualized experiences based on real-time mood and intent.
With neural processing units (NPUs) and on-device AI, personalization will increasingly occur locally—at the edge—offering users unique UI/UX for the same product.
For example: While the John Doe is browsing for a shoe, the AI might understand the context (based on recent searches) and suggest items to pick for Jane Doe to make the occasion more memorable — leading to a personalized landing page, rendered by the browser.
Strategic Action: Embrace headless commerce and personalization-at-the-edge, powered by API-driven architectures.
3. Enhanced Customer Service and Interaction Models
AI-powered browsers will interface directly with customer support bots, automating issue resolution and several other tasks across platforms.
For example: If an order is delayed, the AI browser can check FedEx tracking, contact Etsy’s chatbot, confirm refund eligibility, and update the user—all autonomously.
Strategic Action: Invest in AI-interoperable customer service platforms with robust AI-friendly APIs to support cross-channel handoffs.
4. Cross-Brand Shopping & Product Comparisons
AI browsers will allow multi-site, cross-brand comparisons without needing to visit multiple websites.
For example: “Compare ingredients, pricing, and reviews of the top three night creams from ELC brands.” or “List the unique features of an OLED TV from Samsung and LG that users rave about on forums”.
Strategic Action: Provide trustworthy, transparent, and machine-readable product data to surface favorably in AI-driven evaluations.
5. New Monetization Models for the Browser Economy
Expect pay-as-you-go or subscription models, where browsers monetize actions (e.g., $0.01 per curated recommendation).
Brands may lose control if they do not actively participate in these ecosystems, have a strategy to lay the ground rules and negotiate for a win-win formula.
Strategic Action: Build digital strategies that make sure your brand’s ecosystem is AI-friendly or compatibility with AI commerce ecosystems.
The “AI-Aware” Digital Strategy Roadmap
A complete overhaul to become “AI-First” or “AI-Native” isn’t necessary overnight for Retail and CPG firms. Instead, a strategic pivot to “AI-aware” commerce systems will ensure readiness and steadiness in revenue:
Focus Area
Strategic Imperative
Semantic Web Architecture
Implement structured data and semantic HTML for AI readability.
Expose AI-friendly APIs for search, retrieval, and transactions.
Natural Language Optimization
Write content the way users speak their queries, not just keyword-stuffed pages.
Personalization at the Edge
Enable on-device, privacy-friendly personalization and UI adaptations.
Seamless AI Assistant Handoff
Design systems for fluid interaction between AI browsers and your brand’s AI agents.
Mobile & Accessibility Design
Future-proof digital assets for accessibility across devices.
What Leaders Must Do Next
Priority
Action
Timeline
Short-Term
Audit websites for AI readability and structured metadata.
Next 6 months
Mid-Term
Build API-first commerce experiences and semantic storefronts.
Next 12 months
Long-Term
Develop an AI-agent strategy and personalization-at-the-edge plan.
Within 18–24 mo.
Closing Thought
In the next 12–18 months, the most successful retail brands won’t be those with the most visually appealing websites. Instead, they’ll be the ones with the most AI-literate commerce systems.
The key to success lies in formulating a strategy around how to effectively train, provide data to, and collaborate with AI agents – essentially, “optimizing for AI shoppers” in the same way organizations currently optimize for traditional search engine optimization (SEO).
Those who build invisible, proactive, machine-friendly shopping experiences—designed for both humans and autonomous agents—will unlock outsized value.
To Retail and CPG CxOs:
Begin preparing now for your next significant customer—who may very well be an AI agent acting on behalf of your consumers. 🤖🛒
Organizations frequently discuss the importance of data quality and its impact on business value. Even the most sophisticated analytical models falter with outdated and unreliable data, resulting in misleading recommendations, inaccurate forecasts, suboptimal business decisions, and wasted resources.
In today’s data-driven world, organizations face information overload, often storing vast amounts of data without considering its diminishing relevance. While some clients recognize this “information overload” and exercise caution regarding what they capture, others maintain the status quo, leading to increased costs, flawed insights, low customer satisfaction, and poor performance.
“What goes into production environment, stays there.”
“As per regulations, we need to store 7 years of data. But we only flag records. Do not delete them!”
Organizations must understand that the value of data is not static; it evolves and degrades over time. This understanding is crucial for accurate analysis and effective decision-making. In fact, one dimension of quality is timeliness, which translates to the lifetime value of data or data aging. This article explores the concept of ‘data aging’ and its implications for the success of data-driven initiatives.
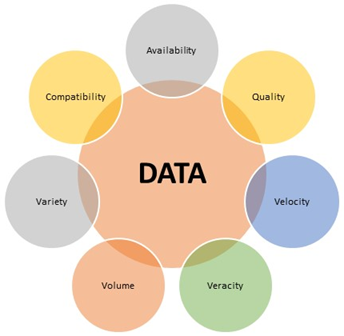
The four dimensions of data
To calculate the lifetime validity of data, one must understand the four dimensions of data, commonly referred to as the 4V’s: Volume (Vo), Velocity (Ve), Variety (Va), and Veracity (Vr). The first three—Volume, Velocity, and Variety—are straightforward.
Dimension
Description
Volume (Vo)
The sheer amount/quantity of data from various sources. E.g., transactions, logs.
Velocity (Ve)
The speed at which data is generated and processed. Also known as the rate of data flow. E.g., real-time, batch.
Variety (Va)
The diverse forms/types of data. E.g., structured, semi-structured, and unstructured data.
Veracity (Vr)
The reliability and trustworthiness of data. E.g., accuracy, consistency, conformity.
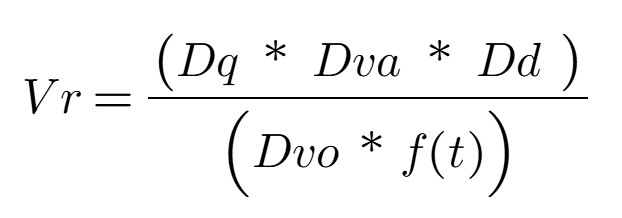
Let’s focus on the fourth V, Veracity (Vr) which encompasses the accuracy and truthfulness aspects of data. Veracity is a function of four components that directly influence the insights and Business Value (Bv) generated.
This equation represents a more traditional view and emphasizes the fundamental aspects of data veracity: data quality, data value, data density, data volatility, and the impact of time. This equation is suitable for situations where the dataset is small and data volume, velocity, and variety are relatively stable or not significant factors. In short, the focus is on the intrinsic quality and reliability of the data.
The components explained:
Quality of Data (Dq): A normalized quantitative score, derived from a comprehensive data profiling process, serves as a measure of data quality (Dq). This score encapsulates the 4Cs: completeness, correctness, clarity, and consistency.
Data Volatility (Dvo): Refers to the duration for which the data or dataset remains relevant. It quantifies the spread and variability of data points, extending beyond mere temporal change. While some define volatility as the rate of data change, this definition emphasizes the overall fluctuation, i.e., rate at which data changes[1]. For example, customer preferences. A numerical scale, such as 1 to 10, can be used to represent the spectrum from low to high volatility.
Data Value (Dva): Represents the actionable insights, cost savings, or value of derived knowledge obtained through analytical modeling, such as correlation and regression. In essence, it answers the question, “What is the practical significance of this data analysis?” A numerical scale, such as 1 to 10, can be used to represent the range from low to high data value.
Quality of Data Density (Dd): Measures the concentration of valuable, complete, and relevant information within a dataset. It emphasizes the presence of meaningful data, rather than sheer volume. For example, a dataset with numerous entries but missing essential fields exhibits low data density quality. This assessment is determined through a combination of data profiling and subject matter expert (SME) evaluation.
Computing the lifetime value using Vr
All the above components are time-dependent, and any equation involving time will have an associated lifetime or value. Hence, the value of data either remains constant (for a period) or degrades over time, depending on the type of data. Now, let us integrate the 3Vs (Volume, Velocity and Variety) into this equation (Vr).
To briefly explain, data quality, value, and density are in the numerator because high values for these components improve data reliability. The other components negatively impact trustworthiness with higher values and are therefore in the denominator. To tailor the equation to specific use cases, weight coefficients can be incorporated to reflect the relative importance of each factor. These weights should be adjusted based on the unique context or requirements of the analysis. Generally, a lower overall score indicates that the data is aged, exhibits reduced stability, and/or possesses diminished reliability. This characteristic can be particularly valuable in scenarios where historical trends and patterns hold greater significance than contemporary data, such as retrospective studies or long-term trend analyses.
Real-world examples
Consider customer purchasing behavior data. Companies utilize segmentation and personalization based on customer lifecycle stages for targeted marketing. As individuals transition through life stages, their purchasing patterns evolve. Consequently, relying on data from a specific historical point—such as during a period of job searching, financial dependence, or early adulthood—to predict purchasing behavior during a later stage of financial independence, high-income employment, family life, or mid-adulthood is likely to produce inaccurate results.
Similarly, credit rating information demonstrates the impact of data aging. Financial institutions typically prioritize a customer’s recent credit history for risk assessment. A credit rating from an individual’s early adulthood is irrelevant for risk calculations in their mid-40s. These examples underscore the principle of data aging and its implications for analytical accuracy.
Strategies for mitigating the effects of data aging
Data Governance: Establishing clear data retention and data quality standards.
Data Versioning (by customer stages): Tracking changes to data over time to understand its evolution.
AI Infusion: Utilizing AI at every stage of the data lifecycle to identify and address data anomalies, inconsistencies and data decay.
Conclusion
The truth is, data isn’t static. It’s a living, breathing entity that changes over time. Recognizing and adapting to these changes is what separates effective data strategies from those that quickly become obsolete. If you found this post insightful, please comment below! In a future post, I will explore the impact of other components like data gravity and data visualization on business value. Let me know if that’s something you’d like to see!
Reference:
“The Importance of Data Quality in a Data-Driven World” by Gartner (2023)
“Data Decay: Why Your Data Isn’t as Good as You Think It Is” by Forbes (2022)
McKinsey & Company, “The Age of Analytics: Competing in a Data-Driven World” (2023)
Deloitte Insights, “Data Valuation: Understanding the Value of Your Data Assets” (2022)
[1] “rate of change of data” is typically represented as a derivative in mathematics. It gives a precise value showing how one variable changes in relation to another (e.g., how temperature changes with time). “rate at which data changes” emphasizes the speed or pace at which the data is changing over time (pace of data variation).
To keep pace with ever-present business and technology change and challenges, organizations need operating models built with a strong data and analytics foundation. Here’s how your organization can build one incorporating a range of key components and best practices to quickly realize your business objectives.
Executive Summary
To succeed in today’s hypercompetitive global economy, organizations must embrace insight-driven decision-making. This enables them to quickly anticipate and enforce business change with constant and effective innovation that swiftly incorporates technological advances where appropriate. The pivot to digital, consumer-minded new regulations around data privacy and the compelling need for greater levels of data quality together are forcing organizations to enact better controls over how data is created, transformed, stored and consumed across the extended enterprise. Chief data/analytics officers who are directly responsible for the sanctity and security of enterprise data are struggling to bridge the gap between their data strategies, day-to-day operations and core processes. This is where an operating model can help. It provides a common view/definition of how an organization should operate to convert its business strategy to operational design. While some mature organizations in heavily regulated sectors (e.g., financial services), and fast-paced sectors (e.g., retail) are tweaking their existing operating models, younger organizations are creating operating models with data and analytics as the backbone to meet their business objectives. This white paper provides a framework along with a set of must-have components for building a data and analytics operating model (or customizing an existing model).
The starting point: Methodology
Each organization is unique, with its own specific data and analytics needs. Different sets of capabilities are often required to fill these needs. For this reason, creating an operating model blueprint is an art, and is no trivial matter. The following systematic approach to building it will ensure the final product works optimally for your organization. Building the operating model is a three-step process starting with the business model (focus on data) followed by operating model design and then architecture. However, there is a precursory step, called “the pivots,” to capture the current state and extract data points from the business model prior to designing the data and analytics operating model. Understanding key elements that can influence the overall operating model is therefore an important consideration from the get-go (as Figure 1 illustrates). The operating model design focuses on integration and standardization, while the operating model architecture provides a detailed but still abstract view of organizing logic for business, data and technology. In simple terms, this pertains to the crystallization of the design approach for various components, including the interaction model and process optimization.
Preliminary step: The pivots
No two organizations are identical, and the operating model can differ based on a number of parameters — or pivots — that influence the operating model design. These parameters fall into three broad buckets:
Design principles: These set the foundation for target state definition, operation and implementation. Creating a data vision statement, therefore, will have a direct impact on the model’s design principles. Keep in mind, effective design principles will leverage all existing organizational capabilities and resources to the extent possible. In addition, they will be reusable despite disruptive technologies and industrial advancements. So these principles should not contain any generic statements, like “enable better visualization,” that are difficult to measure or so particular to your organization that operating-model evaluation is contingent upon them. The principles can address areas such as efficiency, cost, satisfaction, governance, technology, performance metrics, etc.
Sequence of operating model development
Current state: Gauging the maturity of data and related components — which is vital to designing the right model — demands a two-pronged approach: top down and bottom up. The reason? Findings will reveal key levers that require attention and a round of prioritization, which in turn can move decision-makers to see if intermediate operating models (IOMs) are required.
Influencers: Influencers fall into three broad categories: internal, external and support. Current-state assessment captures these details, requiring team leaders to be cognizant of these parameters prior to the operating-model design (see Figure 2). The “internal” category captures detail at the organization level. ”External” highlights the organization’s focus and factors that can affect the organization. And “support factor” provides insights into how much complexity and effort will be required by the transformation exercise.
Operating model influencers
First step: Business model
A business model describes how an enterprise leverages its products/services to deliver value, as well as generate revenue and profit. Unlike a corporate business model, however, the objective here is to identify all core processes that generate data. In addition, the business model needs to capture all details from a data lens — anything that generates or touches data across the entire data value chain (see Figure 3). We recommend that organizations leverage one or more of the popular strategy frameworks, such as the Business Model Canvas1 or the Operating Model Canvas,2 to convert the information gathered as part of the pivots into a business model. Other frameworks that add value are Porter’s Value Chain3 and McKinsey’s 7S framework.4 The output of this step is not a literal model but a collection of data points from the corporate business model and current state required to build the operating model.
Second step: Operating model
The operating model is an extension of the business model. It addresses how people, process and technology elements are integrated and standardized.
Integration: This is the most difficult part, as it connects various business units including third parties. The integration of data is primarily at the process level (both between and across processes) to enable end-to-end transaction processing and a 360-degree view of the customer. The objective is to identify the core processes and determine the level/type of integration required for end-to-end functioning to enable increased efficiency, coordination, transparency and agility (see Figure 4). A good starting point is to create a cross-functional process map, enterprise bus matrix, activity based map or competency map to understand the complexity of core processes and data. In our experience, tight integration between processes and functions can enable various functionalities like self-service, process automation, data consolidation, etc.
The data value chain
Standardization: During process execution, data is being generated. Standardization ensures the data is consistent (e.g., format), no matter where (the system), who (the trigger), what (the process) or how (data generation process) within the enterprise. Determine what elements in each process need standardization and the extent required. Higher levels of standardization can lead to higher costs and lower flexibility, so striking a balance is key.
Integration & standardization
Creating a reference data & analytics operating model
The reference operating model (see Figure 5) is customizable, but will remain largely intact at this level. As the nine components are detailed, the model will change substantially. It is common to see three to four iterations before the model is elaborate enough for execution.
For anyone looking to design a data and analytics operating model, Figure 5 is an excellent starting point as it has all the key components and areas.
Final step: Operating model architecture
Diverse stakeholders often require different views of the operating model for different reasons. As there is no one “correct” view of the operating model, organizations may need to create variants to fulfill everyone’s needs. A good example is comparing what a CEO will look for (e.g., strategic insights) versus what a CIO or COO would look for (e.g., an operating model architecture). To accommodate these variations, modeling tools like Archimate5 will help create those different views quickly. Since the architecture can include many objects and relations over time, such tools will help greatly in maintaining the operating model. The objective is to blend process and technology to achieve the end objective. This means using documentation of operational processes aligned to industry best practices like Six Sigma, ITIL, CMM, etc. for functional areas. At this stage it is also necessary to define the optimal staffing model with the right skill sets. In addition, we take a closer look at what the organization has and what it needs, always keeping value and efficiency as the primary goal. Striking the right balance is key as it can become expensive to attain even a small return on investment. Each of the core components in Figure 5 needs to be detailed at this point, in the form of a checklist, template, process, RACIF, performance metrics, etc. as applicable – the detailing of three subcomponents one level down. Subsequent levels involve detailing each block in Figure 6 until task/activity level granularity is reached.
Reference data & analytics operating model (Level 1)
The operating model components
The nine components shown in Figure 5 will be present in one form or another, regardless of the industry or the organization of business units. Like any other operating model, the data and analytics model also involves people, process and technology, but from a data lens.
Component 1: Manage process: If an enterprise-level business operating model exists, this component would act as the connector/ Component 1: Manage Process: If an enterpriselevel business operating model exists, this component would act as the connector/bridge between the data world and the business world. Every business unit has a set of core processes that generate data through various channels. Operational efficiency and the enablement of capabilities depend on the end-to-end management and control of these processes. For example, the quality of data and reporting capability depends on the extent of coupling between the processes.
Component 2: Manage demand/requirements & manage channel: Business units are normally thirsty for insights and require different types of data from time to time. Effectively managing these demands through a formal prioritization process is mandatory to avoid duplication of effort, enable faster turnaround and direct dollars to the right initiative.
Sampling of subcomponents: An illustrative view
Component 3: Manage data: This component manages and controls the data generated by the processes from cradle to grave. In other words, the processes, procedures, controls and standards around data, required to source, store, synthesize, integrate, secure, model and report it. The complexity of this component depends on the existing technology landscape and the three v’s of data: volume, velocity and variety. For a fairly centralized or single stack setup with a limited number of complementary tools and technology proliferation, this is straightforward. For many organizations, the people and process elements can become costly and time-consuming to build.
To enable certain advanced capabilities, the architect’s design and detail are major parts of this component. Each of the five subcomponents requires a good deal of due diligence in subsequent levels, especially to enable “as-aservice” and “self-service” capabilities.
Component 4a: Data management services: Data management is a broad area, and each subcomponent is unique. Given exponential data growth and use cases around data, the ability to independently trigger and manage each of the subcomponents is vital. Hence, enabling each subcomponent as a service adds value. While detailing the subcomponents, architects get involved to ensure the process can handle all types of data and scenarios. Each of the subcomponents will have its set of policy, process, controls, frameworks, service catalog and technology components.
Enablement of some of the capabilities as a service and the extent to which it can operate depends on the design of Component 3. It is common to see a few IOMs in place before the subcomponents mature.
Component 4b: Data analytics services: Deriving trustable insights from data captured across the organization is not easy. Every organization and business unit has its requirement and priority. Hence, there is no one-size-fits-all method. In addition, with advanced analytics such as those built around machine-learning (ML) algorithms, natural language processing (NLP) and other forms of artificial intelligence (AI), a standard model is not possible. Prior to detailing this component, it is mandatory to understand clearly what the business wants and how your team intends to deliver it. Broadly, the technology stack and data foundation determine the delivery method and extent of as-a-service capabilities.
Similar to Component 4a, IOMs help achieve the end goal in a controlled manner. The interaction model will focus more on how the analytics team will work with the business to find, analyze and capture use cases/requirements from the industry and business units. The decision on the setup — centralized vs. federated — will influence the design of subcomponents.
Business units are normally thirsty for insights and require different types of data from time to time. Effectively managing these demands through a formal prioritization process is mandatory to avoid duplication of effort, enable faster turnaround and direct dollars to the right initiative.
Component 5: Manage project lifecycle: The project lifecycle component accommodates projects of Waterfall, Agile and/or hybrid nature. Figure 5 depicts a standard project lifecycle process. However, this is customizable or replaceable with your organization’s existing model. In all scenarios, the components require detailing from a data standpoint. Organizations that have an existing program management office (PMO) can leverage what they already have (e.g., prioritization, checklist, etc.) and supplement the remaining requirements.
The interaction model design will help support servicing of as-a-service and on-demand data requests from the data and analytics side during the regular program/project lifecycle.
Component 6: Manage technology/ platform: This component, which addresses the technology elements, includes IT services such as shared services, security, privacy and risk, architecture, infrastructure, data center and applications (web, mobile, on-premises).
As in the previous component, it is crucial to detail the interaction model with respect to how IT should operate in order to support the as-aservice and/or self-service models. For example, this should include cadence for communication between various teams within IT, handling of live projects, issues handling, etc.
Component 7: Manage support: No matter how well the operating model is designed, the human dimension plays a crucial role, too. Be it business, IT or corporate function, individuals’ buy-in and involvement can make or break the operating model.
The typical support groups involved in the operating-model effort include BA team (business technology), PMO, architecture board/group, change management/advisory training and release management teams, the infrastructure support group, IT applications team and corporate support group (HR, finance, etc.). Organization change management (OCM) is a critical but often overlooked component. Without it, the entire transformation exercise can fail.
Component 8: Manage change: This component complements the support component by providing the processes, controls and procedures required to manage and sustain the setup from a data perspective. This component manages both data change management and OCM. Tight integration between this and all the other components is key. Failure to define these interaction models will result in limited scalability, flexibility and robustness to accommodate change.
The detailing of this component will determine the ease of transitioning from an existing operating model to a new operating model (transformation) or of bringing additions to the existing operating model (enhancement).
Component 9: Manage governance: Governance ties all the components together, and thus is responsible for achieving the synergies needed for operational excellence. Think of it as the carriage driver that steers the horses. Although each component is capable of functioning without governance, over time they can become unmanageable and fail. Hence, planning and building governance into the DNA of the operating model adds value.
The typical governance areas to be detailed include data/information governance framework, charter, policy, process, controls standards, and the architecture to support enterprise data governance
Intermediate operating models (IOMs)
As mentioned above, an organization can create as many IOMs as it needs to achieve its end objectives. Though there is no one right answer to the question of optimal number of IOMs, it is better to have no more than two IOMs in a span of one year, to give sufficient time for model stabilization and adoption. The key factors that influence IOMs are budget, regulatory pressure, industrial and technology disruptions, and the organization’s risk appetite. The biggest benefit of IOMs lies in their phased approach, which helps balance short-term priorities, manage risks associated with large transformations and satisfy the expectation of top management to see tangible benefits at regular intervals for every dollar spent.
IOMs help achieve the end goal in a controlled manner. The interaction model will focus more on how the analytics team will work with the business to find, analyze and capture use cases/ requirements from the industry and business units. The decision on the setup – centralized vs. federated – will influence the design of subcomponents.
DAOM (Level 2)
To succeed with IOMs, organizations need a tested approach that includes the following critical success factors:
Clear vision around data and analytics.
Understanding of the problems faced by customers, vendors/suppliers and employees.
Careful attention paid to influencers.
Trusted facts and numbers for insights and interpretation.
Understanding that the organization cannot cover all aspects (in breadth) on the first attempt.
Avoidance of emotional attachment to the process, or of being too detail-oriented.
Avoidance of trying to design an operating model optimized for everything.
Avoidance of passive governance — as achieving active governance is the goal.
Methodology: The big picture view
Moving forward
Two factors deserve highlighting: First, as organizations establish new business ventures and models to support their go-to-market strategies, their operating models may also require changes. However, a well-designed operating model will be adaptive enough to new developments that it should not change frequently. Second, the data-to-insight lifecycle is a very complex and sophisticated process given the constantly changing ways of collecting and processing data. Furthermore, at a time when complex data ecosystems are rapidly evolving and organizations are hungry to use all available data for competitive advantage, enabling things such as data monetization and insight-driven decisionmaking becomes a daunting task. This is where a robust data and analytics operating model shines. According to a McKinsey Global Institute report, “The biggest barriers companies face in extracting value from data and analytics are organizational.”6 Hence, organizations must prioritize and focus on people and processes as much as on technological aspects. Just spending heavily on the latest technologies to build data and analytics capabilities will not help, as it will lead to chaos, inefficiencies and poor adoption. Though there is no one-sizefits-all approach, the material above provides key principles that, when adopted, can provide optimal outcomes for increased agility, better operational efficiency and smoother transitions.
Endnotes
1 A tool that allows one to describe, design, challenge and pivot the business model in a straightforward, structured way. Created by Alexander Osterwalder, of Strategyzer. 2 Operating model canvas helps to capture thoughts about how to design operations and organizations that will deliver a value proposition to a target customer or beneficiary. It helps translate strategy into choices about operations and organizations. Created by Andrew Campbell, Mikel Gutierrez and Mark Lancelott. 3 First described by Michael E. Porter in his 1985 best-seller, Competitive Advantage: Creating and Sustaining Superior Performance. This is a general-purpose value chain to help organizations understand their own sources of value — i.e., the set of activities that helps an organization to generate value for its customers. 4 The 7S framework is based on the theory that for an organization to perform well, the seven elements (structure, strategy, systems, skills, style, staff and shared values) need to be aligned and mutually reinforcing. The model helps identify what needs to be realigned to improve performance and/or to maintain alignment. 5 ArchiMate is a technical standard from The Open Group and is based on the concepts of the IEEE 1471 standard. This is an open and independent enterprise architecture modeling language. For more information: www.opengroup.org/subjectareas/enterprise/archimate-overview. 6 The age of analytics: Competing in a data-driven world. Retrieved from www.mckinsey.com/~/media/McKinsey/Business%20Functions/McKinsey%20Analytics/Our%20Insights/The%20age%20of%20analytics%20Competing%20in%20a%20data%20driven%20world/MGI-The-Age-of-Analytics-Full-report.ashx
How many times have we gone through the routine of seeing data issue after data issue when something goes live in production, no matter how much of due-diligence was put in place? Despite having industry leading frameworks, operating models, air-tight processes, best-in-class templates, data issues creep in at multiple touch-points. Based on my assessment of UAT/post Go-Live scenario at various clients, more than 60% of the issues faced is related to data. Some of the organizations assessed had some sort of a piecemeal approach (or a quick fix in their parlance) to reduce data issues but it was more reactive and not sufficient, foolproof, scalable and/or repeatable.
The project types assessed include data migration, data integration, data transformation and creating/enhancing a bunch of analytical reports. In all the scenarios, data issue topped the charts as the number one pain area to be addressed. This is because the “data” aspect was either overlooked or not given the required level of importance. None of the processes were designed keeping data as the core/foundation. Everyone understands that data is an asset, yet no one has designed the frameworks models and processes keeping data as the key focus. It is just one module or component in the entire spectrum of things. Addressing all aspects around data in a systematic manner in addition to the existing parameters is key to reducing data issues.
Figure: 1 – Key areas around data
Figure 1 shows some of the key areas that need to be addressed around data as a bare minimum to reduce data related issues.
A conceptual “Data Readiness” framework that can be customized and scaled up as required to suit various project types is shown here. Conducting an end-to-end data readiness check using such a well-defined framework, covering all major touch-points for data will help address data related issues early. While this framework is predominantly helpful during the approval/kick-off phase of projects, it extends all the way till the project goes live and declared stable.
Figure: 2 – Base framework for Data readiness
This highly scalable and customizable framework comes with supporting artifact(s) for each area as applicable. Refer Figure 3 for details. These artifacts are spread across people, process and technology areas. This will automatically address issues like schedule overruns, cost overruns, rework, low user confidence on IT, etc. as it touches upon all the aspects related to data.
The biggest advantage of this framework is that it can be easily blended with any existing governance model and PMO model an organization might be following.
The WOW factor – Find that one thing that will create the wow factor for your client and consider half the engagement done. Unfortunately this at times strikes a day before the final presentation, but trust me the one night left in your hand is more than sufficient to do wonders.
See through your clients’ eye – The key things required to find this wow factor is the ability to see the vision of your client. Feel their problem. Understand their priorities and decrypt what they are not able to explain in words.
Power of Analogy – Use a simple analogy to restate the clients’ true problem. Use the same or another simple analogy to explain the solution. I normally take the example of food (if I am hungry) or a completely different industry or topic like cars or gadgets depending on the circumstance.
Let the numbers speak – When you know you are with a tough client, it’s always safe to let the numbers speak. Quantify everything in the simplest and most logical way possible. Include as many stakeholders as required into the equation to remove anomalies and there you have a nice little shield to defend yourself.
The animated story – The term ‘animation’ here stands for the visualizations. We all know the attention span and time from a CxO is highly limited. Everyone is looking for innovation and simplicity. With prescriptive and cognitive analytics gaining popularity, it is necessary to let the charts and pictures form the core of your presentation, while having a nice story crafted around this core. Some consultants would call this gift wrapping. Also make sure your presentation can tell the story you intended all by itself, as that is the cherry on the cake.
Know not just thy client but also their industry – If your client is a consulting firm, the amount of content you stuff in a slide does not matter, attention to detail does. Get all your facts triple checked! It will only take 6 seconds for them to process the entire slide and rip you apart. The first question is most likely, “what do you mean by that statement” or “where did you get that number from?”
If it is a financial client, make sure you are careful with the usage of red color. And do have a lot of charts backed by numbers. It only takes a few seconds to process this kind of content for them. On the other hand, if your client is in the Consumer Goods or Retail segment, use icons, cartoons and animations. It keeps them glued to your presentation and helps them digest the content faster and better.
I still have not figured out if region has an impact but culture definitely has. This is from my experience talking to a client in Thailand, Jakarta and Malaysia.
Sell the solution to your team first – the best way to test the solution you have built is to try selling it to your own team. No matter how much time and effort you put in, give an ear to your team members (especially the junior most staff as the most abstract and raw thinking comes from them). No consensus with your team is as good as you are a dead man even before the battle starts.
The selling of assets, divisions or subsidiaries to another corporation or individual(s) is termed divestiture. According to a divestiture survey conducted by Deloitte, “the top reason for divesting a business unit or segment is that it is not considered core to the company’s business strategy” and “the need to get rid of non-core assets or financing needs as their top reason for divesting an asset”. In some cases, divestiture is done to de-risk the parent company from a high potential but risky business line or product line. Economic turnaround and wall of capital also drives the demand for divestitures.
Divestitures have some unique characteristics that distinguish it from other M&A transactions and spin-offs. For example, the need to separate (aka disentangle) business and technology assets of the unit being sold from that of the seller before the sale is executed. Performing the disentanglement under tighter time constraints, i.e. before the close of the transaction, unlike in the case of an acquisition scenario adds to the complexity.
The critical aspect in the entire process is data disposition. Though similar technologies could have been deployed on the buyer and seller side, the handover can end up painful if a formal process is not adopted right from the due-diligence phase. This is because in the case of divestiture, the process is not as simple as a ‘lift-shift and operate’ process. There is a hand full of frameworks available in the market detailing the overall process in a divestiture scenario nevertheless the core component which is “data” is touched upon at surface level and not expanded enough to throw light on the true complexities involved.
What does the trend indicate?
Divestitures and carve-outs are very common in Life Science, Retail and Manufacturing.
Deloitte Survey Report on Divestiture
If we observe the economic movements and divestiture trend over the past decade, it is clear that the economic conditions have a direct correlation and significant impact on divestiture. So organizations have to proactively start assessing their assets at least annually to understand which assets are potential candidates for divestitures and prepare for the same. This way, when the time is right the organization would be well prepared for the transition services agreement (TSA) phase.
The bottom-line
Overall planning is a critical success factor, however that process not involving sufficient planning around the “data” component can result in surprises at various points during the course of divestiture and even end up in breaking the deal. End of the day the shareholders and top management will only look at the data to say if the deal was successful or not.
Faster due-diligence, quicker integration, visible tracking of key metrics/milestones from the start is what one looks for. As per industry experts, having a proactive approach in place has helped sellers to increase the valuation of the deal.
One of the key outputs of this framework is a customized technology and data roadmap. This roadmap will contain recommendations and details around the data and technology complexities that need to be addressed prior, during and post the divestiture to ensure higher success rate for both the selling and buying organization.
The Divestiture Model – Buyer and Seller Perspective
Broadly the Divestiture model has three components: Core, Buyer and Seller:
Core component: Handles all activities related to overall due-diligence related to data such as identifying data owners and stewards, data disposition strategy, value creation opportunity (VCO) and enterprise level data integration with core applications at the buyer and seller end.
Seller component: Focuses on seller side activities related to data like data inventory, business metadata documentation, data lineage/dependency, business process, data flow/process flow diagrams and level of integration with enterprise apps, business impact on existing processes and resource movement (technology and people).
Buyer component: Focuses on buyer side activities related to data like data mapping, data integration, data quality, technology, capacity planning and business process alignment.
Governance: The entire process is governed by a 360 degree data/information governance framework to maintain the privacy, security, regulatory and integrity aspects of data between the two organizations.
Divestiture Model – The Core
Addressing the “data” component:
Selling Organization
Only a few sellers understand the fact that just getting a deal signed and closed isn’t always the end. From a pre-divestiture perspective, the organization should have a well-defined process for possible carve outs, a good data inventory with documented business metadata, documented business processes around the non-performing assets and a clear data lineage and impact document. Armed with this information, the selling organization can get into any kind of TSA comfortably and answer most of the questions the buyer will raise during their due-diligence.
From a post-divestiture perspective, the selling organization needs to assess what technologies and processes need to be tweaked or decoupled to achieve the company’s post-divestiture strategy. A plan to minimize the impact of operational dependencies on existing systems and processes with enterprise applications like ERP when the data stops coming in. If this was not done thoroughly and analyzed well in advance, it can have a crippling effect on the entire organization. Typical mistake committed by the selling organization is, just looking at the cost savings due to alignment/rationalization of infrastructure and missing the intricate coupling the data has at enterprise level.
Having a divestiture strategy with data as the core of the framework can address a host of issues for the selling organization and speed up the pace of transaction.
Buying Organization
There could be two potential scenarios when it comes to the buying organization. Either the organization already has the product line or business unit and is looking to enhance its position in the market or the organization is extending itself into a new line of business with no past hands-on experience. In the case of the former, the complexities can be primarily attributed towards migration and merging of data between the two organizations. Questions like what data to keep/pull, what technology to use, what data requires cleansing, similarities in processes, capacity planning to house the new data, what are the tweaks that will be required to existing reports, the new reports that need to be created, to show the benefit of the buy to shareholders, etc. arise.
The pre-divestiture stage will address most of the questions raised above and based on the parameters a strategy is drawn for data disposition. During the divestiture stage, when the data disposition is actually happening, new reports, scorecards and dashboards are built to ensure complete visibility across the organization at every stage of the divestiture process.
In the latter case where the organization is extending itself into a new line of business, questions like should a lift and shift strategy be adopted or should just the key data be brought in or should it be a start from a clean state, etc. arise. There is no one correct answer for this as it depends on the quality of processes, technology adopted and data coming from the selling organization.
Divestiture Data Framework
The Divestiture Data Framework was designed to highlight the importance of the core component which is “data”.
Divestiture Data Framework
One of the key outputs of this framework is a customized technology and data roadmap. The roadmap will contain recommendations and details around both data and technology complexities that need to be addressed prior, during and post the divestiture to ensure higher success rate for both the selling and buying organization.
Caveat: This post is only to educate the people on the quality, standard of processes and customer care one can expect with Standard Chartered Bank (SCB) in India. This post in no way is aimed at driving the existing customers or potential customers away from having a relationship with SCB. Everything stated in this post is backed by various reference numbers that could be verified with SCB and purely based on my experience.
Background:
Relationship with SCB: January 2013 to February 2014
Purpose: Home Loan
Time taken to close home loan: 27th November, 2013 to 6th February, 2014
No. of reference numbers/complaints/callback requests raised: 18+
No. of calls to SCB customer care: 35+ calls covering over 270+ minutes in just over 2 months
This post is divided into sections detailing what one can expect at various stages of interaction with SCB. Though the relationship with SCB started with the purpose of having a home loan, I was also sold a top-up loan under the name of liability insurance and a SCB “Preferred Banking” credit card.
Reason for closure of loan – Sudden surge in Interest rate!
SCB raised my interest rate directly from 10.15% to 10.9% while every other bank including HDFC and ICICI was way below this number. When asked to reconsider my interest rate, they gave me 10.39% (same rate offered to customers taking new loans) provided I pay about 11K as processing fee. Points to note:
This processing fee comes at a time when RBI is working on removing it completely and other banks are waiving off quoting an offer or some such thing
If you do the math to breakeven (assuming you paid the 11K processing fee), you will need an absolute minimum of 6 months in the case of my loan
Not sure if SCB thinks that its customers are mostly dumb or too rich and that they can get away with these things.
Sales Team:
The sales person like in any other private bank was good in selling their products. They also make verbal promises. As a customer or potential customer, what you should be aware:
Get everything in written or mailed to you from their official mail ID
Without this anything you say at the branch or to their call center team has no validity and will not be entertained
Proof: A verbal promise that pre-payment cheques will be collected from you at your office or residence is possible only with that letter. When the time came and I reached out to them, the response was, “Sir, you need to go to the branch and give the cheque. There is a form you need to fill.” When asked about the promise of having them collected and so on, “Sorry sir, you will have to go to the Koramangala branch only.” Sales staffs name: Bharathi.
Get the process for closure of loan or any service you want clearly explained and documented (specific to your loan/request)
Without this be ready for surprises in terms of last-minute delays, new processes being explained from time-to-time, etc.
This applies mostly around the time when they try to up-sell and cross-sell. Example: credit card and insurance
It is common to hear about new policies and/or charges introduced by SCB just about the time when you thought everything is done
Do not let the sales person force you to take a liability insurance and treat it as a Top-up loan
Liability insurance (sold by their staff Pankaj) being treated as a top-up loan is good for the agent as it helps them meet their targets. However, this leads to complications when it comes to closing of loan
Though you were told it is only liability insurance, you the customer should know that the sales person treated it as a top-up loan and complicated things. Now you have actually got two loans in hand
Assurance that they will help you at the time of closing the loan is no use as when you call them, they will tell you to call the customer care and follow it up with them
Showing liability insurance as a top-up loan and tying it to the primary home loan, will now need you, the customer to be cautious and closing each one of them manually by raising a request
SCB systems are not advanced enough to show all the details on the customer care reps. Screen so it is “always” your fault and not the banks fault
Registration amount must be clarified before going to sub-registrar’s office
This is the first bank where the bank tells the customer how to do fraud and save money
Proof: During registration of my property at sub-registrars’ office, the sales person had already assumed that I will register the property at a lower rate (not at the actual rate I bought the property at) and prepared the documents accordingly. In addition, all documents related to the loan were dispatched to SCBs Central Processing Unit in Chennai. Now I was being told by the agent to go ahead with the registration at a lower rate as it is beneficial to me (in terms of saving money). When I insisted on registering the property at the actual rate I bought, I was told it is not possible to bring the documents back from Chennai. We had to request them to connect us to the regional manager so we can escalate and only then did they bring the documents back and register the property at actual rate
At the branch:
During my handful of visits to the Koramangala branch in Bangalore, I observed that only two service desks will be open at any instant of time to handle all kinds of requests. Even if there are 10 customers waiting to be served, and other staffs are either freely roaming around or sitting in their cabins, no extra counter will be opened.
SCB Systems & Process Quality:
SCB systems seem to be a little primitive as most of the time you will hear the customer care say that they need a minute to pull up your details on their screen as the system is slow or they need to transfer the call to someone else as their system hanged
Proof: Please ask SCB to give all call transcripts and you can confirm this
SCB systems cannot show all details related to a customer
Proof: Even after closing of my credit card, and informing the representatives that I no longer hold a SCB card, offers like a pre-approved loan on the SCB credit card issued to me were being repeated by the customer care
When a request is made to the customer care team to close a loan, you have to explicitly specify each loan number. Mentioning the primary loan account and informing the customer rep. to close everything related to it will not help. Informing that you will ultimately need the original documents back and they need to do everything related to the closing of loan will also not help. This is because the system does not show the same
Proof: Even at the branch, when I gave the final cheque and asked whether everything is done from my end and I will get the original documents, the person at the branch checked his screen and confirmed, “Yes Sir. It’s all done. You will get an SMS within 7 working days. Once you get that, you can fix an appointment and collect the docs.”
Managing of workflows in SCB is a manual process
Proof: When a staff says, “they are marking your case on priority” it only means they wrote down, “high priority” in notes and the respective teams has to manually look into it. This is one of the reasons why I had to raise many complaint requests after SLA expired
Proof: If the EMI date falls close to the date in PTQ (Pre-closure letter), rest assured your wait is going to be longer. The team does not like to manually intervene and stop the EMI or change the workflow to have things processed fast
Courier of documents from Chennai to Bangalore can take up to 15 working days
Normal process: You will get an SMS once the documents have been dispatched from Chennai. This SMS will say you can call the branch and take an appointment to collect the docs. As per the SMS when you call, you will be given a date that is 3 days from the date of your call to collect documents
Your bad luck process: SMS will say you can call the branch and take an appointment to collect the docs. As per the SMS when you call, if the customer rep does not know about this three-day thing he/she will tell you to call after 3 days and book an appointment. When you do so after 3 working days, the customer rep who might have a slightly better experience than the previous rep you spoke to, will say, “Sir, you can only get an appointment after 3 working days!” This is how SCB drives you nuts!
Retention Team:
If the amount of loan for closure is high (not sure what is high for SCB) or low (25K for my liability insurance), the request will be kept on hold for a longer time before approval.
Even for the closure of liability insurance (top-up loan), the retention team has to approve
Even if you are ready to continue the liability insurance with SCB, their process says I cannot if I want the original documents linked to the primary loan
The above is a good example to show how their systems are designed to drive customers away. I had to pay a small penalty on the liability insurance because of SCBs great process. Wish I can go to the court and make SCB pay the penalty for their pathetic systems and processes.
Customer Care:
The team will often use these lines:
“I am marking your case to be taken on Priority”
“By End of day, we will get back to you”
“I will personally follow up and get back to you by tomorrow”.
Now here is the funny part, one day I asked them what is EOD for SCB? Is it 4pm, 5pm? And they had absolutely no clue what End of day is. They are just told to say, “End of day”. If you call after 6pm, they will tell you, “…everyone has left for the day and someone will get back to you by tomorrow positively”.
Only way to make them call you is to place a call back request and hope to get a call back the following day. Note: If you do not get a callback within 24hrs and you call the customer care, the call back request will be treated as complete and will be closed
Proof: My conversation with Moni in Escalations team is proof of the same. She was hell-bent on closing a callback request whose SLA was expiring their “EOD”. No request to keep the callback request open will be entertained. You can call the team after sometime and be rest assured that the call back request was closed
The team has the freedom to raise as many tickets (Reference numbers) as they please. This is because every ticket they give you buys them time
Proof: Number of requests I have raised in the just 2 months
Toll free number will connect you randomly to either their Chennai office or the Bangalore office based on availability. So a promise made by a floor manager/supervisor/team lead in one office cannot be followed by his/her counterpart in another office. There is no facility to route the call to the other office or get information for you. You the customer has to place a call back request and wait 24 hours for a reply.
Other option is to keep calling or keep your fingers crossed to get connected to the branch you want and hope the person is in office. Some people like supervisor, Mr. Manjunath comes to office only at 12 noon (he himself said this) and will not be available after 6pm
Any promise of personal follow-up from SCB is useless as you still have to call them and remind them
Proof: My interaction with Mr. Manjunath R and Miss. Arthy Jaganathan
Credit card:
This is one of the most notorious cards I have seen till date.
Ensure the free credit card given to you is used at least 4 times within the first 3 months period or so. Else you will be levied a charge of Rs.250/- for non-usage
Want to talk to their customer care more than two times in a month? Be ready to flush Rs.50/- per call from the 3rd call you make
Redeem all your points – get the gifts – wait for the statement to get generated – pay the outstanding amount and place a request for closure of card. Theoretically, after 7 working days, the card is closed. But SCBs systems are so good, that the redemption fee of Rs. 111.24/- can appear after 2 months. Now that your card is closed, the only way to make the payment is, you the customer must take the pain of either going to the bank or an ATM with a cheque. Wow!
By the way, when asked about this to the customer care, they do not accept it is their fault, they still hold you responsible. If this amount came up after 6 months, you still owe the bank. The bank is not responsible for you having closed the card long back
CEO’s office:
I was so pissed off with the customer care team that I decided to let the CEO India & South Asia Operations, Mr. Sunil Kaushal know about the service quality so others don’t have to suffer like me. Guess what!
Not even a courtesy acknowledgement mail from CEOs office. Nice email etiquette for a British multinational banking and financial services company
First time I mailed about the quality of loan process, second time it was about the quality of credit card process. In this mail, I requested indirectly for a courtesy acknowledgement. So the mail was forwarded to the same team I was interacting with and they acknowledged receiving the mail
Conclusion:
If you choose SCB, be ready to face some or all of this. If you found reading this long post was pain, you can understand how much pain I was put through by this bank in just 2 months.
***Will post the typical process flow for loan closure in SCB shortly.
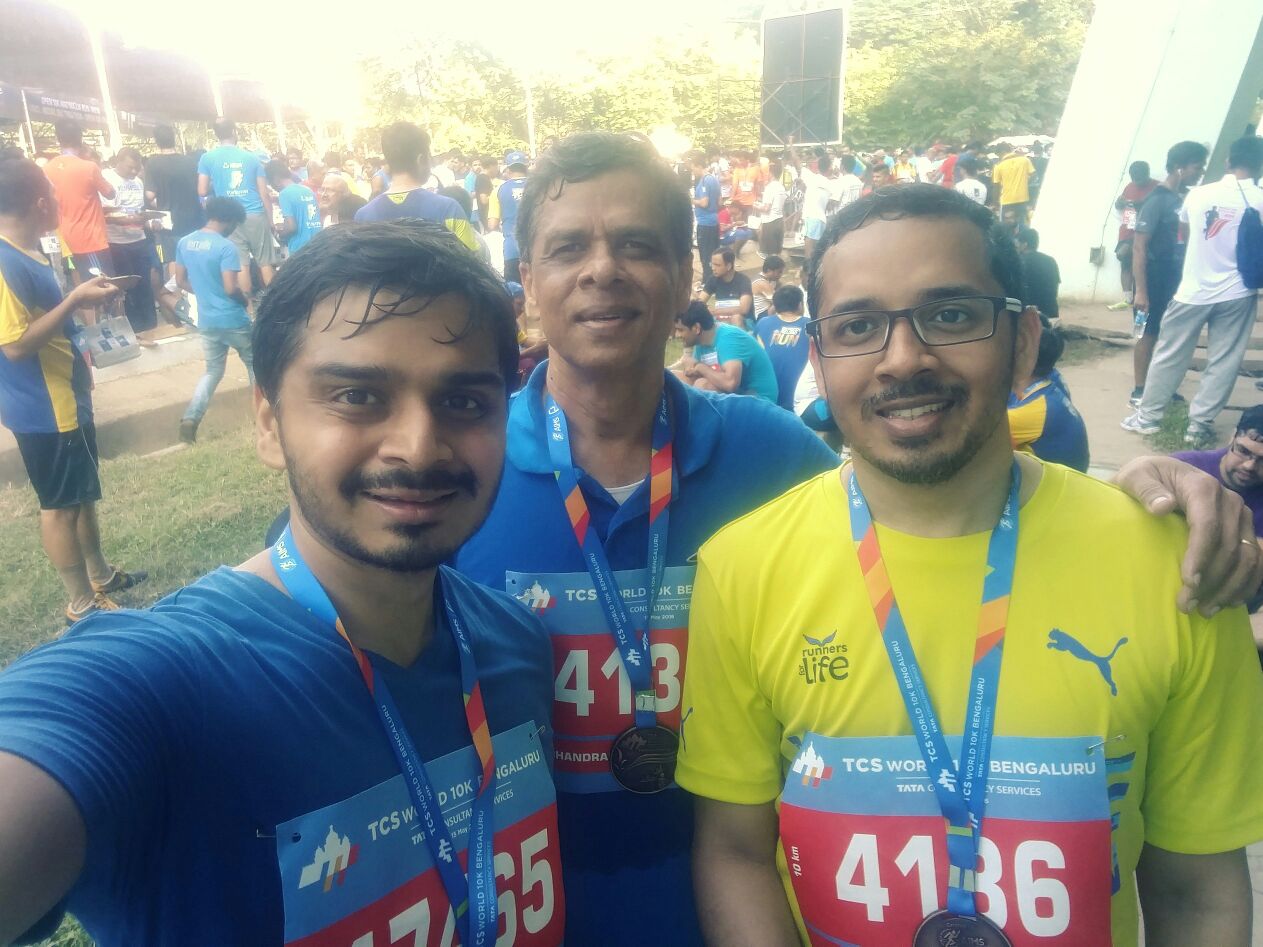
It all started with Dad wanting some company for the 10K run and checking if I would give him company.
The TCS World 10K run on 19th May 2013 was my first run/marathon. The max I have ever run was about 7K on the road while in Chennai (morning jog to the beach). I used to give my dad company at Lalbagh Park on Saturday/Sunday mornings for a jog, but I always ended up doing two rounds less than him. Shame on me for my poor stamina.
Three or four days before the run, I decided to check if I still had any hope of completing the 10K and managed to pull 8Kms in about an hour inside Lalbagh. So there was some hope, as I knew I could walk the remaining 2 kms in 20 minutes 😉
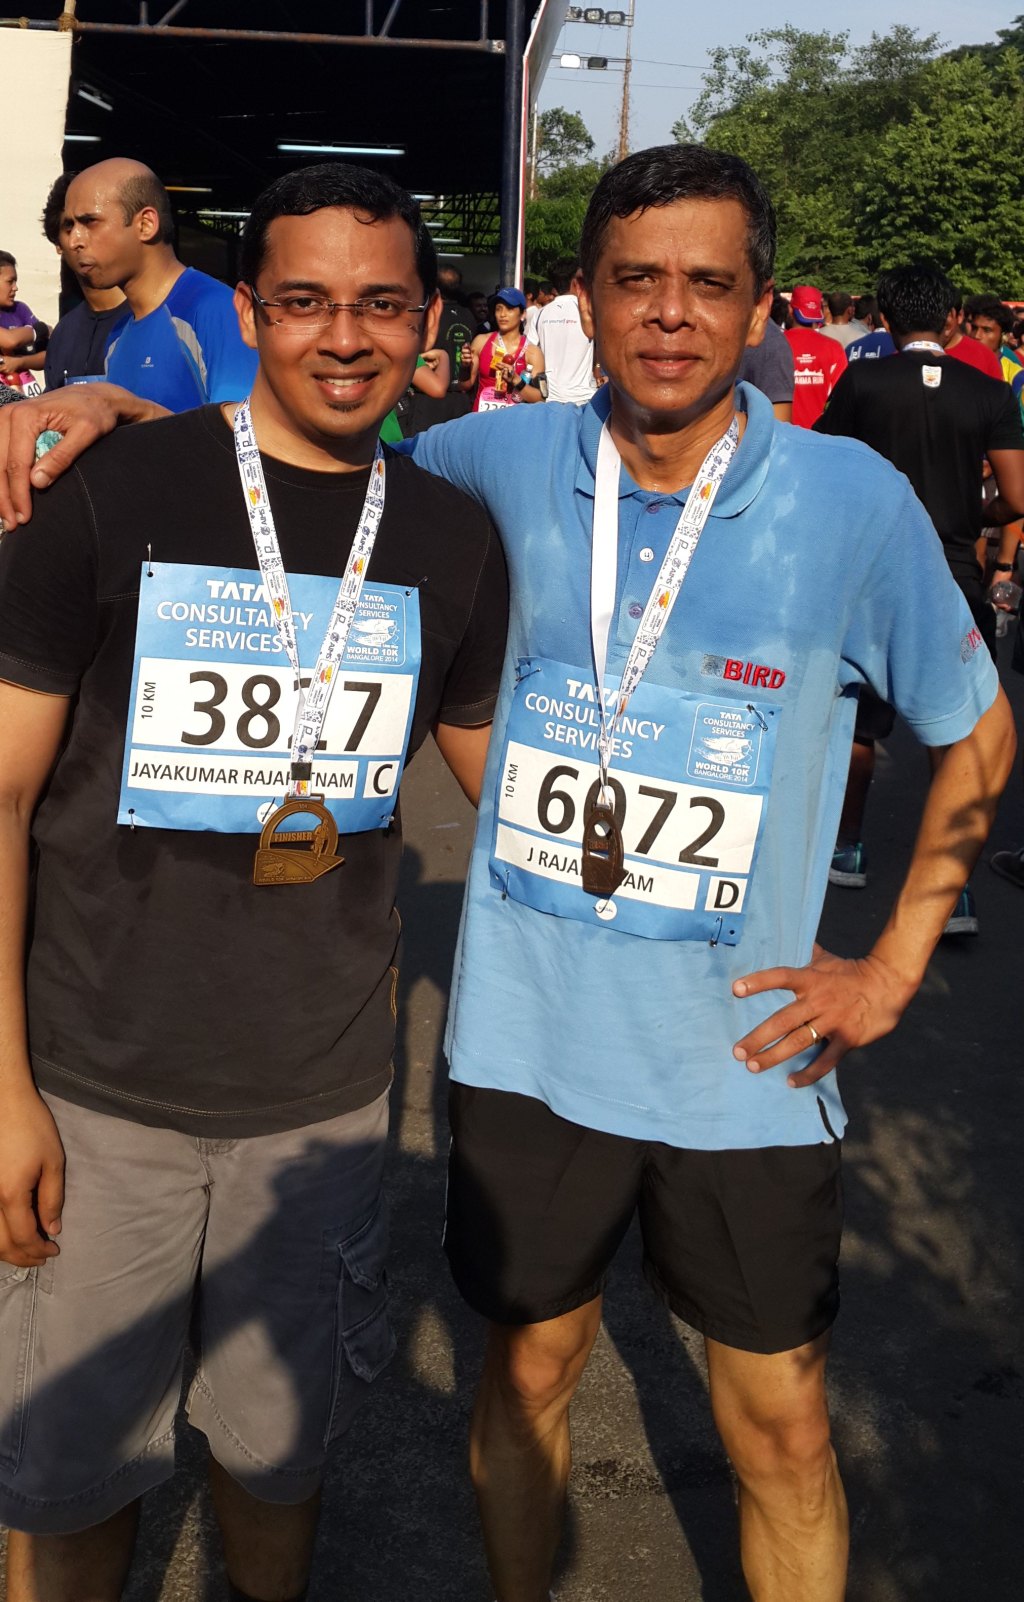
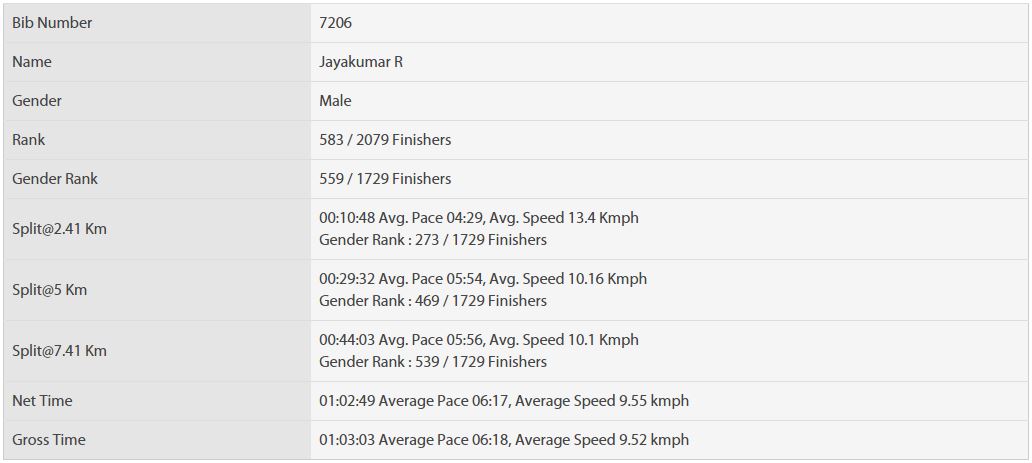
TCS 10K – 19th May 2013
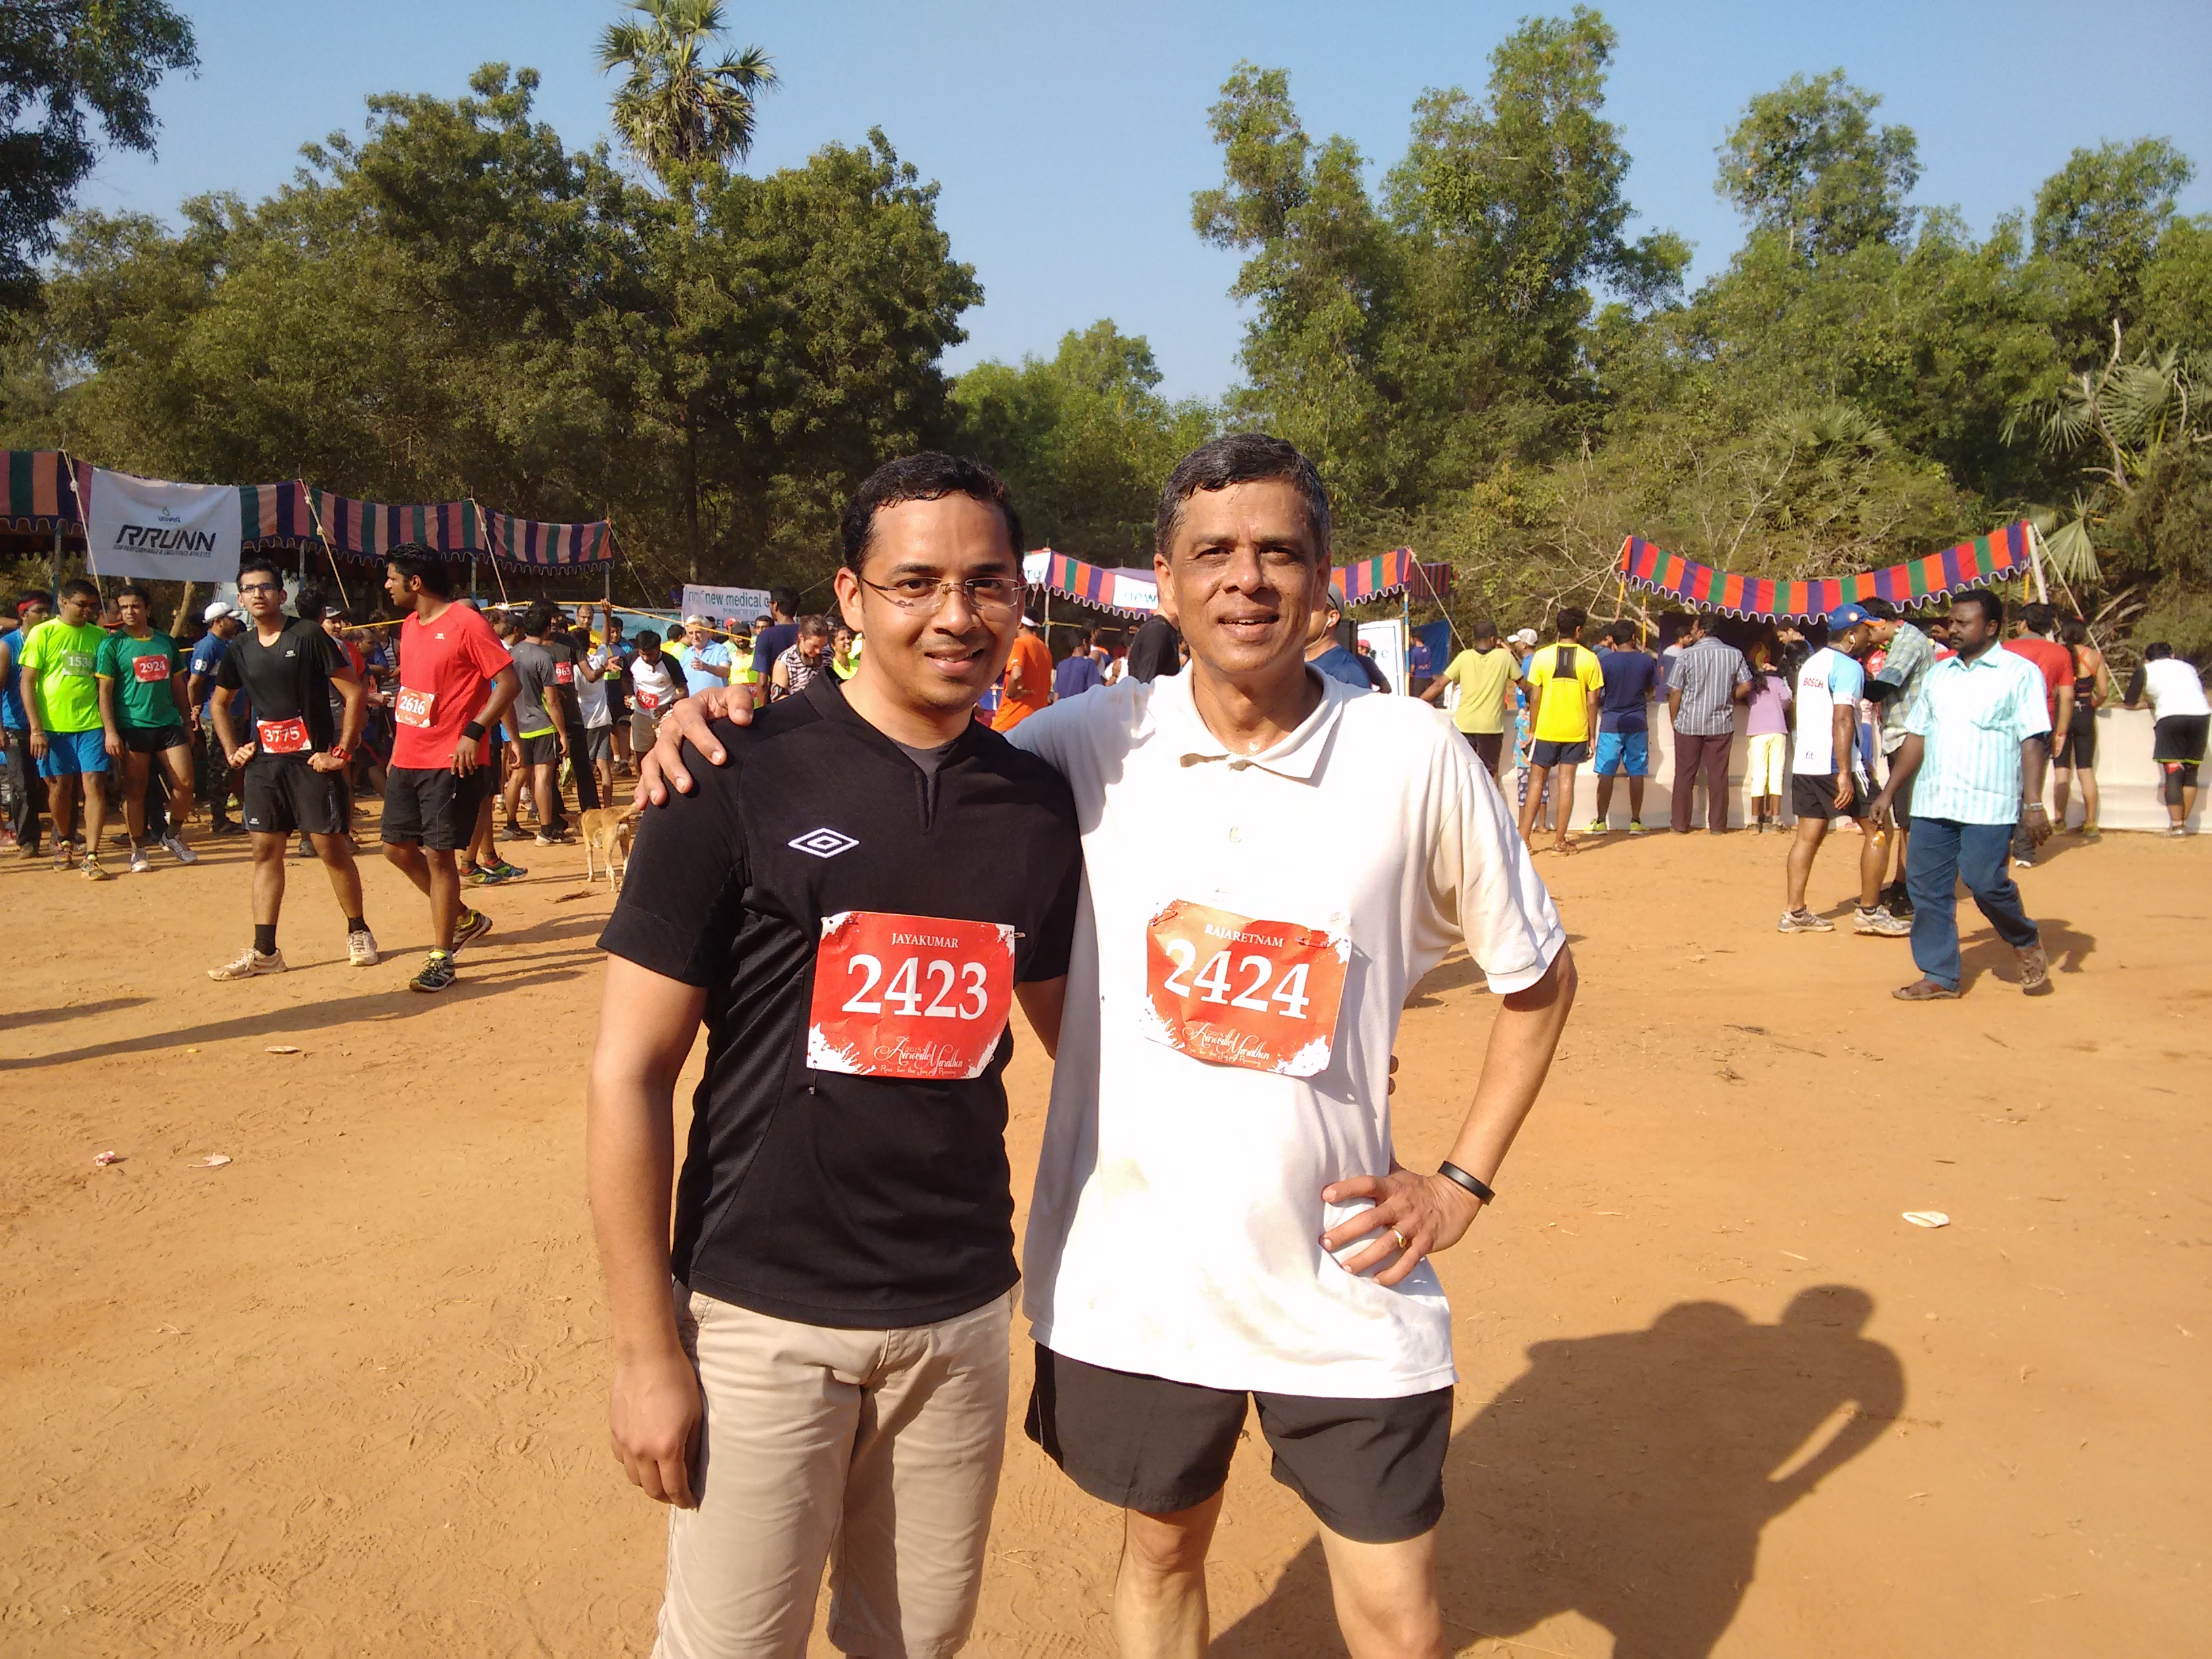
My dad took part in this 10K in 2012 and was eligible to start as part of Group B (those who have a timing of >55 minutes and <1 hour 20 minutes). Unfortunately, he did not get Group B (for unknown reasons), which he was eligible for. Anyway, my dad didn’t mind, as I was there for company, and he wanted to run with me. He gave me enough tips based on his previous running experience. The first tip was that the TCS run never starts on time. This was true! I followed most of the tips religiously and got a net time of 1 hour, 3 minutes, and 19 seconds (Bib #8177). My dad was trailing me by a minute.
Dad n Son – Post TCS 10k
Thanks to my favorite app, Sports-Tracker. It kept reminding me I had a long way to go before stopping. At the end of the race, I felt the after-effects of not having practiced enough, stretched enough and followed a proper diet before the run. To top it all, the impact of a bad/poor quality Reebok shoe that had no cushions to absorb the strain on my legs while running on the road. My first lesson in terms of how important the shoes you select to run are.
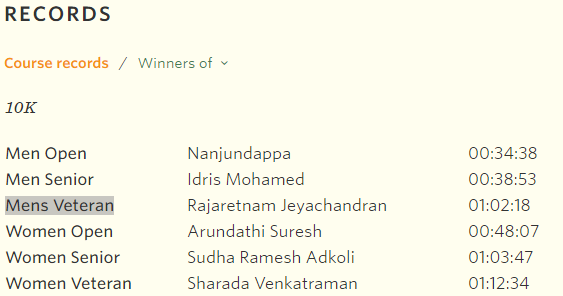
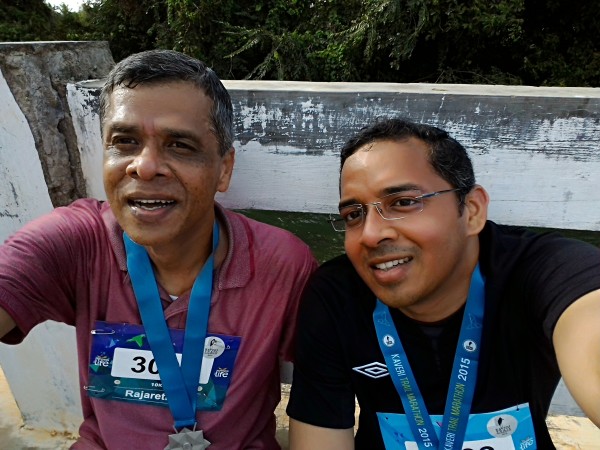
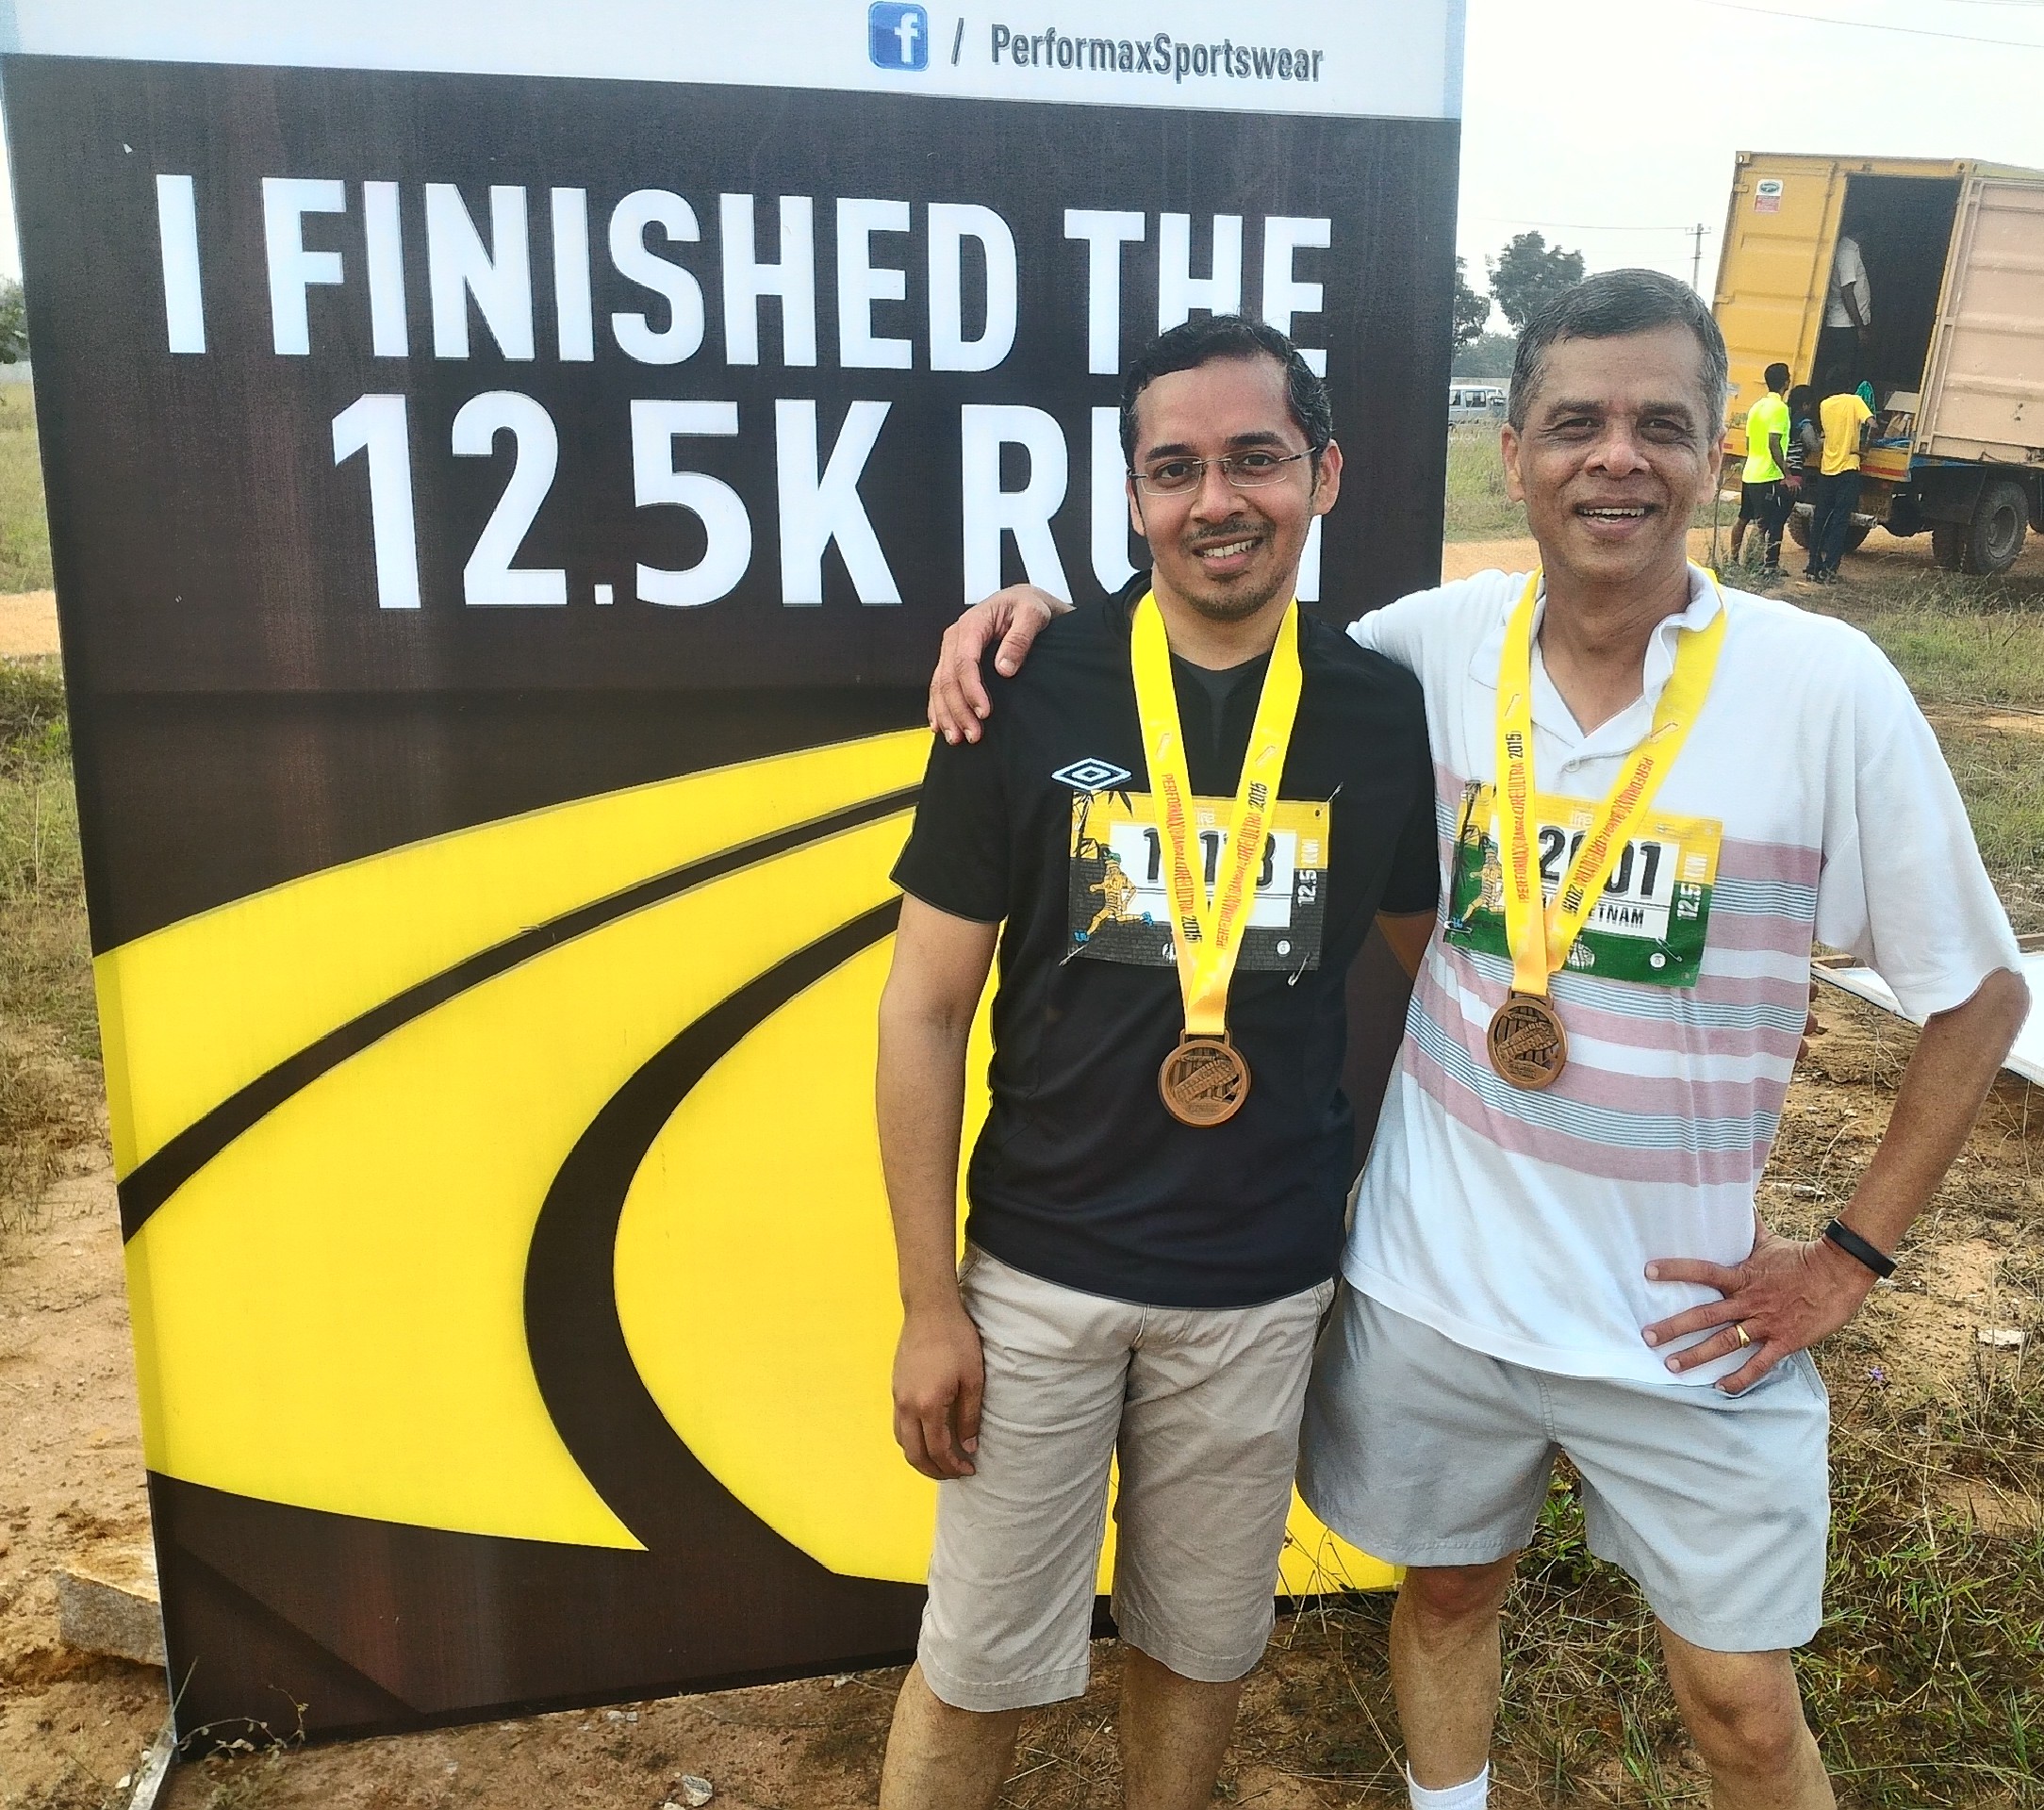
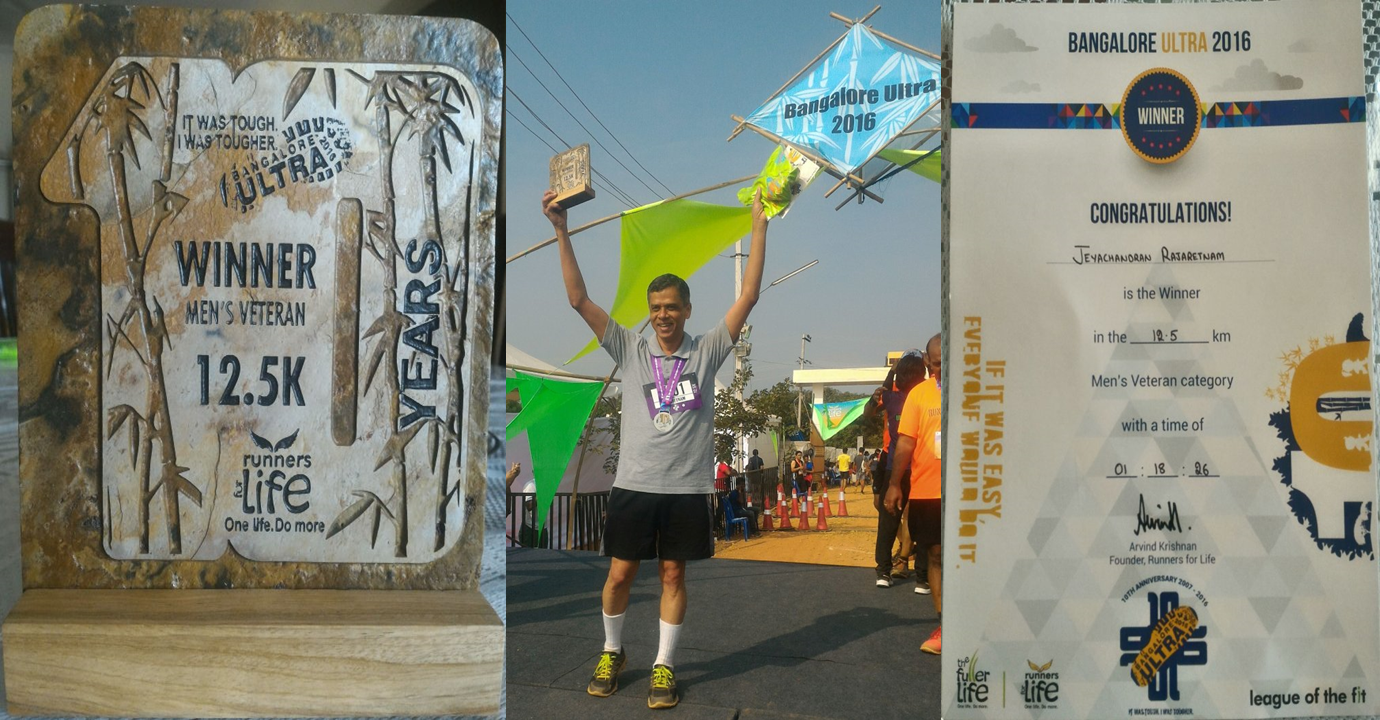
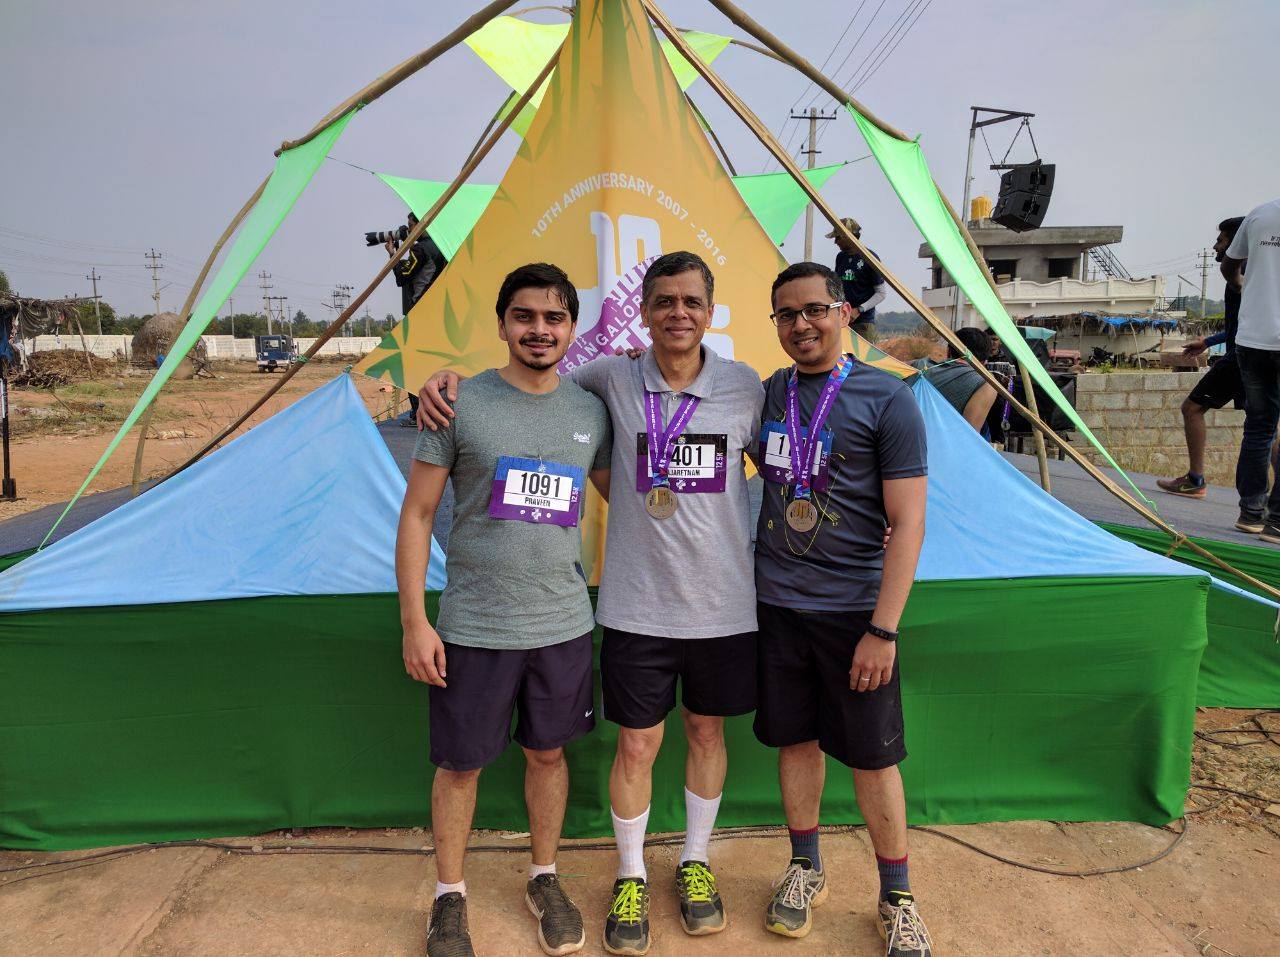
Bangalore Ultra 12.5K – 10th November 2013
This time, Dad was in my native place, so I did not have his company 🙁 However, he ran the Pondicherry 10K and the Kaveri 10K run post the TCS 10K.
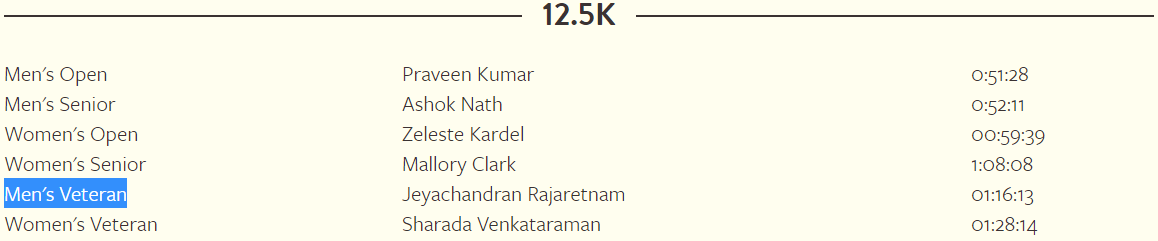
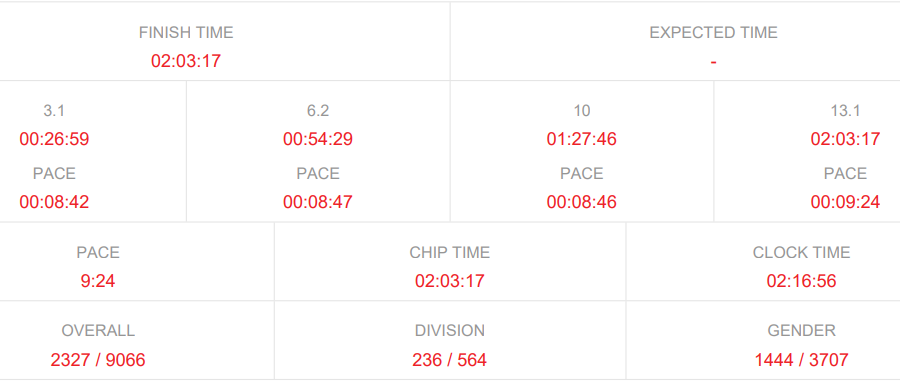
Bangalore Ultra 12.5K Results
Having never touched 10K after the TCS run and not having practiced at all during the three weeks before the run date, I knew this was difficult. The track was an excellent bamboo trail off Henur Road. The route is here. Soft ground (muddy road) with ups & downs, so no strain on legs – very similar to the farm at my native place. But getting to this place was a nightmare, as I live in South Bangalore. It took me 1.5 hours to reach it, despite having started at 4:15 a.m. My wifey decided to wake up at 4 am and give me company, My Sweet wifey! It was cold on that day, with mist all over the place, as there were no high rises. Just farms!
Bib #1164, completing the 12.5 kms in 1hr 21min 22sec. The weather played a very vital role, and thanks to the great treadmills in my apartment (pun intended) from “Sportrack” for showing the incorrect distance covered. Learning: If you feel the distance you are covering on a treadmill is higher than normal, chances are it is high. Never trust them! It will give you false hope, make you run at the wrong pace, and make you end up with bad timing.
SBI Midnight Marathon – 14th December 2013
I first learned about midnight marathons while in New York waiting to see the useless Times Square ball drop. This event was a little tempting. My colleague Sunil also registered, so I had a company. Bib #6567 clocked 1hr 00min 44sec. What a way to finish the year!
Some say, “Interest in marathons starts with just completing the run. Then it is all about beating your earlier time.” Very true! And this can be very addictive (in a good way). My next target is under an hour. I am still not confident about doing a half-marathon, but I will keep it on my To-Do list!
TCS 10K – 18th May 2014
I got into race category C with bib #3827 and my dad was in category D. A few seconds delayed start for my dad, but he completed well before me with an excellent timing of 1hr 1min 15sec while I clocked my worst ever net finish time of 1hr 4min 48sec. Blame it on the lack of practice and the Sports-Tracker app, which just wouldn’t work.
Dad n Son – TCS 10k 2014
I am used to seeing the distance, time, and pace and taking breaks to catch my breath. The app worked for a few minutes and got stuck. So I started too fast and ended up losing all my energy way early in the course. Another lesson on pacing right.
SBI Midnight Marathon – 20th December 2014
This one is my second attempt at the midnight marathon. Unlike the previous year, this year AIMS-IAAF certified the course. The organizers also took the feedback comments from runners last year and had sufficient electrolytes and water throughout the course.
Thanks to Praveen (my brother) for leaving the office early, dropping me off at the venue, and picking me up. One interesting fact here is that I landed from Kuala Lumpur in the morning, and the same day evening I did this run (Bib #7206). After a three-month tiring engagement with hardly any time to practice, clocking 1hr 2min 49sec does not make me feel bad.
To top it all, somewhere around the 3.5 km mark, I got a sprain on my right knee, and it was slowing me down. I had two options: either give up or keep running and make it my last run. I chose the latter. Btw, a big thanks goes to my manager for approving my high-priced ticket, so I can land in India on time for this event.
Bangalore Midnight Marathon 2014
I bought myself a fitness band, VivoSmart, and was testing it during this run. It was pretty accurate, given the fact that it did not have a GPS built-in.
Auroville Half Marathon – 8th February 2015
My first run in 2015 and my first half-marathon… I drove to Pondicherry with my dad, mom, brother, and my wife (Meena). Ran inside the beautiful Auroville with trees to give me shade and the soft ground to absorb all the damage my knee would otherwise take during the 21-kilometer run. For a change, I gave my dad some tips for the half-marathon, and with that, he got an excellent time of 2hrs 11min.
Dad n Son – Auroville Half Marathon 2015
My Dad had bib #2424, and I had #2423. My timing was nowhere close to his 2hrs 11min as I clocked 2hrs 19min and there were at least 100 people who crossed the finish line in this 8-minute gap. Now coming to what I did not like in this marathon. First, there was no finisher medal to keep as memorabilia. Second, the course was not certified. Third, the electrolyte was so diluted in most of the stations that it tasted awful. Finally, they took the start time of the race (6:15 am) instead of when you crossed the start line and ignored the seconds part to calculate our finish time. An old lady was sitting near the finish line under a tent, with an iPad recording all finishers crossing the line so they could calculate the timing. None of this is acceptable to me.
This is when I became picky about which runs I took part in. Must be a certified route. A medal to hang and brag is a must.
Kaveri Trail 10K – 19th September 2015
In 2013, my dad ran the 10K alone, and he used to say a lot about this scenic trail. The following year, we both registered but had to give it a pass as my dad was down with a fever.
Men’s Veteran – 10K Category
This year, my dad got a fancy bib #3000, and I got a bib #1303. Trust me! The pictures on the KTM website and the reality were way too far apart. Yes, it is the Ranganathittu Bird Sanctuary, but there were no birds except for a few crows, lots of cows, buffaloes, and men bathing in the small stream flowing around. So that was a bit of a disappointment. On top of that, it was a sunny day, and the 7 a.m. start, adding a bit more sweat, was not a great run experience.
I just got back from London and was running this with absolutely no preparation in the last four months. My time of 1hr 2min 51sec* is acceptable to me. The best part, my dad was not a Finisher. He was the “Winner” in the Men’s Veteran – 10K category! You are my inspiration to run, Dad!!!
@Finish line – KTM 10K 2015
Talking about the fiasco! KTM went ahead with a local timing chip provider. The chip quality and/or the technology did not go through a proper vetting process. So several runners did not get their timings recorded, and KTM had to rely on the personal time that was recorded on the runners’ respective fitness devices. Luckily, my dad’s device worked. I started my tracker well before I crossed the start line and stopped it well after crossing the finish line, as I forgot about it. Hence, the actual time should be roughly a minute less than the one shown here. Guess it’s another lesson! To start our (personal) tracker when you step on the start line and end it the moment you step on the finish line.
Anyway! I did pour my heart out to the RFL team on the goof-up, and they gave me a complimentary T-shirt or a registration for 2016 KTM or Bangalore Ultra (any segment). Given the sad trail in Kaveri and my bad experience, I picked the 12.5 km Bangalore Ultra.
Performax Bangalore Ultra 12.5K – 8th November 2015
Course record Bangalore Ultra 12.5K
My second attempt at this calm and tranquil trail with Bib #12118 clocked a time of 1hr 17min 21sec.
We did it!!!
This was my dad’s first 12.5K with Bib #12601. He was a little confused about whether to pace for 10 or 12.5K, but he comfortably maintained a steady pace right from the beginning till the end. He crossed me somewhere around the 7 km mark, and I was trailing him for about a kilometer and then gave up. Now the good news! He set the course record in this track under the Men’s Veteran category with 1hr 16min 13sec.
Though he says this talks about the quality of other runners, it’s the regular practice that kept him going and ended the course strong. Practice is the only thing that can help you get the required stamina. Oh, by the way, he got his money back as a T-shirt and a nice memento. You should have seen the excitement when we got home.
I am sure he will break his record next year, but I need to try harder and find some time to practice regularly. Getting under the 1-hour mark is my target. Let me see if it happens in the midnight marathon.
The Real Podium Finish!!!
SBI Midnight Marathon – 5th December 2015
My third attempt came with a lot of expectations that I would get under the 1-hour mark, but unfortunately, it happens to be the worst ever in terms of timing. I barely hit 1hr 5min 41sec.
Bangalore Midnight Marathon 2015
I had the wrong food (at KFC) before the marathon and ended up thirsty throughout the course. On top of that, I missed their water station twice, as it was in a poorly lit area and there were too many runners around me to spot it. I also had to rush at the last minute to the venue because of unplanned stops to pick up dinner, and thanks to KFC for taking over 15 minutes to get the order. Finally, thanks to the great Bangalore traffic for making things even worse. The only good thing was that Meena accompanied me, and she was in the stands cheering for me despite the cold weather.
This event had about 11k runners, and seeing so many crazy folks, including old men and women, run at night startled Meena. Ending the year with four marathons. I hope to do the same in 2016, and if all goes well, hit the sub-1-hour mark.
TCS 10K – 15th May 2016
This was a very special run, as my dad and brother took part. Initially, it was only myself (Bib #4136) and my dad (Bib #4139) who registered for the event. A few days before the registration closed, my brother (Bib #17465) joined us. Just before the special day, my father was down with a cold, a cough, and a bit of fever. I, too, had a bit of a cold and cough, but I was determined to run. On race day, all three wanted to go, as this was the first time we were doing a run together.
TCS 10K 2016
As it was my brother’s first run, he was in Group F but clocked an amazing time of 54min 50sec. The following year, he would get Group B, where he could run more peacefully and get better timing.
Given my dad’s age, the cold, and the cough, his timing of 1hr 2min 24sec is superb. After nine runs, I got under the 1-hour mark and clocked my best timing of 59min 36sec. I was on Cloud 9! Thanks to my wifey for cautiously feeding me protein and carb-filled food at the right time, leading up to the race.
Bangalore Ultra 12.5K – 13th November 2016
This is our second family run – Praveen’s first Ultra, Dad defending his Veteran-Winner record of 2015, and me just enjoying my favorite track. We arrived on time, had no issues parking, did a bit of warm-up, and started our run. Dad (Bib #1401) got a timing of 1hr 18min 26sec (not as good as the previous year), but he still holds the record, and that matters!
Podium Finish again!
Praveen (Bib #1091) did a stunning 1hr 8min, and I did 1hr 20min 2sec with Bib #1176. Lesson learned! The amount of practice and hard work you put in is directly proportional to the output you get. With less than 50 minutes of practice a week, this is what one can expect. I need to get off the laptop and focus on myself too!
Our 2nd Family Run
Rock ‘n’ Roll Seattle Half Marathon – 10th June 2018
After a gap of one year, I took part in a half-marathon. It just so happened that I did a Google search for marathons in the Seattle area and saw this event coming up the following week. I was so excited and searched for a 10K run on their website. To my surprise, there was a 5K, a half-marathon, and a full marathon only. I was like, 5K will not give me the satisfaction of having run, so let’s give the half-marathon a shot. I remember, clearly, my decision to not do another half-marathon after the Auroville run in Feb ’15. But given that I was practicing 3 to 4 times a week for a good two months, I went for it, despite the high registration cost. Post-booking, I checked if my cousin Monisha was interested in running, and she was all in just because the medal looked awesome! Can you believe that???!!! Yes, the Rock n Roll series has some of the best-looking medals. Karthik was into cycling, so he gave this event a pass. Otherwise, it would have been triple the fun!
2018
With no practice or experience doing a half-marathon before, Monisha (Bib #11447) clocked an awesome time of 3hrs 18min 42 sec. And the best part is, she stopped on the way to click some nice snaps of the Seattle skyline and sunrise! While the only thing running through my mind was pacing, and when would the next mile marker come? I had Bib #11067 and clocked my personal best timing of 2hrs 3min 17sec. That’s an average pace of ~8min 45sec for the first 10 miles and ~54min for the first 10K. Now that feels good! Thanks to the awesome weather! I started to sweat only after the 5 kms mark. So you can imagine what the temperature would have been like. Without it, I am sure dehydration and other things would have kicked in early, spoiling the PR.
Rank & Pace
Oh! By the way, I should say thanks to my client who let me work remotely. As they were on the East Coast, I did have the evenings for myself to do these practice runs! Without it, it would not have been possible.
Beat the Blerch Seattle 10K – 15th September 2018
My first 10K on a rainy day – start to finish. No company… but the trail (King County’s Tolt MacDonald Park, Carnation, WA) was simply amazing. With Bib# 3820, running on a near-flat trail using my fingers as a wiper to remove the drops of rain from my specs every other minute, I clocked 57min 09sec.
Goodies…
If you are familiar with the cartoon characters, everyone was there. You will love the atmosphere. People from different countries were here, participating as they were in the area! Oh, by the way, the medal was heavy, unique, and awesome! I loved all the items in the goodie bag, too.
Hot Chocolate 15K Seattle – 3rd March 2019
My first 15K distance and my first run at near zero (32F) temperature with wind chill… To top it off, the elevation was a killer as I did not practice enough.
Best picture of mine while running.
Bib# 50243 with a timing of 1hr 32min 6sec is my worst. However, the one thing I enjoyed in this run was the warm, hot chocolate drink at the end of the run. Perfect! I will run again for this. The other good thing is that I got the best-ever marathon picture taken while running. Thanks to the photographer!
Learning! I know how important the shoes you select to run are. But I didn’t know enough. Hoka One One – Clifton 5 is not my shoe, for sure. Moving from a 11mm drop to a 5mm drop does impact the running style and post-run recovery. I need to go back to my favorite Brooks.
Shamrock 15K Portland – 17th March 2019
This run will always have a special mention. It took 6 years of persuasion to make my beautiful wife, Meena, say yes to a 5K event. She has come to cheer me on a few of my runs (including the midnight run), but she has never said yes to jogging or walking that’s over a couple of kilometers. One might wonder, What’s the big deal? Let me tell you, she is neither a fitness freak nor someone who has an active interest in sports. However, she enjoys a long, lazy walk with good company. So everyone who knows her well found it difficult to believe she really took part in and completed a 5K run.
The whole process of convincing Meena to participate started sometime in late November. It was more like, try the 4-mile walk; it is a very scenic route, etc., etc. Then slowly, I highlighted the fact that 4 miles (6.4 km) is longer than 5K, and she can do the 5K easily. My consultant hat is at work 😉 Then one fine day in February, I made her say or create an expression that sort of looked like a yes (maybe an absent-minded yes) to register for the run. From this time on, there is no turning back. Booked everything before she could change her mind.
The thought of 17th March gave her jitters and some realizations in terms of what she got herself into. But at the same time, her curiosity to understand why there are so many crazy souls running and experiencing the whole thing once for herself took the best of her. The last couple of weeks before the run, she pushed herself to come to the gym with me and do some practice walks on the treadmill. She gave all she had while on the treadmill, elliptical, and cycle. Earlier, she used to do something for a few minutes and then find a nice spot to sit and relax. This time, I had to pull her out of the gym.
We went to Portland a day before the run to collect our bibs at the Expo. Meena got the orange bib# 13870, and I got the blue bib# 21180. She was all excited and, at the same time, very tense. Three reasons: One, other runners looked fit and/or well-trained; two, the distance; and finally, the weather. After the collection of bibs, we walked around downtown, picked up a running jacket, and got back to the hotel. All along, giving her small tips on what to do and what not to do, as I could feel her tension.
The next day, we woke up at 6 am to a bright, sunny day (35F with a wind chill that felt like 30F). We munched some of the yummy brownies Meena had baked for my birthday, then walked toward the start line, which was roughly 5 blocks from the hotel. All the butterflies running through her mind and stomach made her forget the -1 degree Celsius weather for a while. I gave her a few more tips, like my dad did when I took part in the TCS 10K for the first time in 2013. I got her into a corral I felt was right for her speed, and she crossed the start line around 8 am. Thanks to the location-sharing apps, I could see where she was throughout until the start of my 15K at 8:55 am. She got an awesome time of 56min 46sec.
Coming to how I did! I made the mistake of standing in the wrong corral and running with a higher pace (4.35/km) than usual for the first mile, on a stretch that had some elevation to give me a timing of 1hr 34min 44sec (Pace: 10.09/mile). The irony here is that I gave all this as a tip to Meena and I ended up not following any of them. By the way, this is my second run on Clifton 5, and in both runs, I clocked a pace of 10.x/mile. Brooks with a heel-to-toe drop of 11mm gave me 9.x/mile on both the 10K and a half-marathon last year. I’m not going to use this shoe again.
Guess what my current task/target is… Convincing Meena to take part in another 5K and beat her current time of 56min. 😀
Iron Horse Half Marathon, Seattle – 25th August 2019
My second USATF-certified half-marathon with Bib# 1088. It is supposed to be a downhill marathon with an elevation loss of 880′. A beautiful, scenic course where several runners set their PRs. The weather was fine at the start of the run at 8 am (wave 4). For some reason, the terrain looked pretty flat, and I clocked a time of 2hrs 14min 29sec (Pace: 10:16/mile). I was literally dragging myself and walking every couple of hundred meters.
One learning is that practicing on a treadmill is not the same as running on gravel or a road – I could feel the difference in foot strike. At the 10-mile mark, my legs gave up. Compared to my previous marathon (Rock n’ Roll), my VO2 max had taken a hit too. Blame it on the lack of proper practice before the run (a slight fever to make things worse). If I ever run another (half) marathon, I will make sure I do a fair amount of practice on the road, as treadmills give a false hope for long-distance runs.
BMW Dallas Marathon Festival – 10K, Dallas, TX – 10th December 2022
After a gap of 3 years, doing my first official run. Thanks to Covid followed by my relocation to Texas, a new addition to the family, and a change of company. I know this does not justify a 3-year gap. I started the year with a 10K on the treadmill, hoping I would get back to form and do a run this year. With God’s grace, it happened before the year ended.
I heard about this BMW-sponsored Dallas marathon on the radio and decided to register the same day. With Bib #43502, I clocked an official time of 1hr 7min 7 sec. Good crowd, and nice weather; I loved every moment of the run. Happy New Year ’23 in advance!
Hot Chocolate Run – 10K, Dallas, TX – 11th February 2023
After seeing my timing in the BMW Dallas 10K run, I wanted to do some practice and get the timing under the 1-hour mark. A fair amount of 5K runs in January paid off. I couldn’t do much in February because of the cold front that hit for almost three weeks straight. With Bib #30514, I clocked 56min 52sec (i.e., 9:10min/mile). The temperature was 2°C, with the wind chill reducing that to -2°C. I was one of the handful of folks wearing shorts, no windbreaker, and no gloves. I regretted not having a windbreaker at this temperature.
The temperature plays a major role in the performance during the run. I could run without sweating till I crossed the 5K mark. I didn’t need to stop for water at the first station. Saving a few seconds!
During the practice runs I was doing in January, I realized one major thing. I.e., I was feeling the ground during my runs. Then I found I had already clocked 700 kms on my Mizuno, which was resulting in a lack of responsiveness during runs. Given that I was too close to the run, I had to find a shoe that did not require a break-in period. After some quick research, I narrowed down on the Asics Novablast 3.
I did a quick 5K before the run to check if it was the right shoe for my running style, and it was. Not too squishy, the right amount of drop (8mm), very responsive and the foam does not harden much when the temperature drops to 0C (32F). During the practice run, it shaved off 21 sec/min. So I knew I had picked up the right shoe.
Irving Marathon – 10K, Dallas, TX – 1st April 2023
Another run, awesome weather (around 12C), superb crowd, and a beautiful place to run (Las Colinas, Irving, TX). With Bib #3208, I clocked 57min 02sec. Yes, 10 seconds more than my previous run as I miscalculated the walk to the water station and lost a few seconds there. But no regrets as I got under the 1hr mark. Also, because of the bad weather, I could not practice much (at least) ten days before the run. So that also had its impact on the run quality.
Planning for the Irving Frost marathon in December. This route with a run along the riverside reminded me of the San Antonio trip with my sister-in-law. Will do another run on this route anytime.
Spirit of Wipro Run – 5K, Dallas, TX – 9th October 2023
This was a poorly planned event for the Dallas location. The objective of this run was to do some branding. For some reason, this run ended up at a park that is far away from the city, and at 10 am when the sun was shining bright. Even the dog walkers were not present at that time. It was more of a Wipro family event and the route was just about 3 Kms instead of 5 Kms. A total waste of half a day, traveling to this godforsaken place. So net-net, I am not even calling this a run.
Hot Chocolate Run – 5K, Dallas, TX – 10th February 2024
This is my first 5K run and the 3rd hot chocolate run – need to listen to your body when you age. Also, I had the company of a friend (Geetha) for this run. This was her first 5K, and I had the pleasure of passing all the tips I had got and learned over a period. A usual boring trip to the venue and back, all alone, had an awesome company. I hope I can coerce Natraj also to join the next 5K run, so I will get a bigger company next time.
With Bib #157, I clocked 28min 57sec. The three seconds short of 29 minutes look good. Though my target was 27 minutes, I had no regrets as it was a rainy day with puddles to jump over and the use of fingers as wipers to remove mist from the specs (and then wondering how to remove the fingerprints as I cannot see clearly). Just before the run, I reduced my expectation to under 35 minutes, given the weather. Also, I realized what I was wearing was not a rain jacket mid-way through the run. Yes, I got soaked.
Geetha with Bib #3710 had good timing (50min 49sec) for a first-timer in rainy weather.
BMW Dallas Marathon – 8K, Dallas, TX – 14th December 2024
Well… One thing I hate and love about this event is, you need to go to Kay Bailey Hutchinson to get the Bib. No other option. The good part is, you get to collect a lot of goodies from the sponsors. This time we got a lovely glass water bottle. Worth every penny going all the way there. Also, this was my first 8K event. Now, I have done 5K, 8K, 10K, 12.5K, 15K and 21K (half marathon).
The event was fully sold out and we had over 1350 timed runners for the 8K event and over 2500 for the 5K event on Saturday. During the run, while running along Commerce street, we could see the long line of runners. It was a beautiful look. Weather did not play a spoil sport. Right from the time I left home, there was fog/mist all over. Beautiful drive to the venue parking. On reaching the venue, I could see the mist cover the Dallas Downtown buildings and it was a nice view. It was actually warmer than expected at around mid 60s (~18C) half way into the run. I was unfortunately planning for colder weather and had some thick clothes on. This made my body uncomfortably hot at around the 7kms mark degrading my performance.
I had Bib #81039 and clocked 50min 8 sec. Definitely not my best as my target was 45min. Of all the days, I cleared my stomach twice before leaving home, skipped the cheesecake I normally stuff myself with for carbs, and had very little rice, too. I felt very nice while leaving home, and that should have been the signal to eat a little more, but I missed it. At about 4Kms into the run, I could feel the empty stomach. Absolutely no energy to run any further. I had a single small sachet of gel for quick energy release, and that was consumed at the 4kms mark. I just dragged myself with a walk-run strategy and completed the race. But this was a good training run for my next run the following week.
Even at the finish line, there was a lot of stuff to collect as we had a lot of sponsors. Loved the quality of the t-shirt they gave too (compared to 2023).
Let me start with the weather. I arrived at 7 a.m. for the 7:45 a.m. start (for the 10K runners), and the temperature was 32°F with winds making the “Feels like” temperature 29°F. While walking from the parking lot to the event, I noticed folks wearing gloves, beanies, and full track pants/joggers. I could feel myself shivering, and realizing that my thin dri-fit t-shirt, a hoodie (from the hot chocolate run), and my regular shorts were the wrong attire to wear. A few minutes into my warm-up, I noticed men and women wearing thinner tees and shorts like it was summer – I was half-blown away. Did these folks grab a shot of tequila or something?
Coming to the race, I had Bib #10011 (Coral B). I had a very strong start thanks to Meena. She made my favorite tomato gravy to have with rice that morning. The crowd was smaller than expected at less than 400 runners for the 10K. Maybe it was due to the weather. Two minutes into the race, I saw a runner who was running barefoot. I was blown away completely. This runner finished the race just a few minutes after I did.
I skipped the first water station as it was around the 2.7km mark and the weather was “good”. Along the course, I saw a very small Asian kid who had a much better pace than me. I was a little jealous but, hey, hats off to the kid! I finished the race in 58min 12sec. I’m very happy with my time because I was under the 1hr mark. Unlike the BMW marathon the previous week, there weren’t many sponsors, so a little disappointed. Got out of the place early. The one thing that got me attracted to this event was the medal. Beautiful looking one!
Ending 2024 on a great note with 3 runs. Hope to do 3+ in 2025.
Thanks to Monisha for the medal hanger. It’s finally half full with my runs in the US so far.
Time Travel 10K, Dallas, TX – 18th January 2025
I wanted to start the year with something interesting, so I picked this run as it had a 3D-printed medal with cowboy-style boots. The swag was worth it. The interesting part of this race was the weather – an arctic blast. On the race day, the temperature was 32°F and it was windy. I hate the wind! I had to stand in line to pick up my bib, and the few minutes of waiting were a nightmare. I went back to the car to warm up, wearing a beanie (from the Irving Frost marathon) and gloves for the first time during a run.
The run started while I was using the restroom as there was a long line for the port-a-loos – only six for all participants. However, no complaints, as this is a small event. I started the run with several jaywalkers blocking the narrow walking trail at Anderson Bonner Park. I managed to quickly pass most of them and had a clear trail for the rest of the run. This is not one of those expensive races, so the first water station was at the 2.5K turnaround, and the second station at the 5K turnaround with Gatorade. Given the weather, one did not need the water except for a sip or two.
With Bib #5827, I clocked 57 minutes 36 seconds. A good time to start the year! Additionally, I got second place in my age category (40-44). This reminded me of the Kaveri Trail Run where my dad used to achieve podium finishes. Unfortunately, as it was cold, I didn’t even check my official time and headed back home. So, I have no idea what the award for winners in the specific age category is. Will do this run again next year.
Too cold to hold – 10K, Dallas, TX – 1st February 2025
Had to change this to a virtual run at the last minute due to work travels. But did my 10K on the treadmill and clocked 55min 4sec. Definitely cannot brag about this timing as it’s on the treadmill. Loved the swag! Will shoot for the, “Too hot to handle” event in May this year to make up for missing this event.
The Cowtown – 10K, Fortworth, TX – 22nd February 2025
The Cowtown Marathon happens to be the largest multi-event road race in North Texas, has a $10.4 million annual economic impact in Fort Worth, Texas. They host one of the largest youth races in the nation. This was their 47th year. Proceeds from The Cowtown go directly to the C.A.L.F. Program.
The Cowtown C.A.L.F. Program was created in 2009 to help tens of thousands of area children lace up and cross countless finish lines. They visit ~400 schools across North Texas annually, training students in proper running technique and educating them about resting heart rates, the importance of hydration, proper nutrition, and living an active lifestyle. They have made running a 5K race a reality for 60,000+ children in the last 15 years.
To be honest, I initially regretted booking this race as the race starts at 7am for 10K and the venue Will Rogers Memorial Center is 60 miles from my place. To make it worse, the artic winds made the temperature drop to 30F. Believe it or not, I have a PR on this race. With Bib # 16859, I clocked 56min 21sec. This is proof that when you practice before the race, you get a good timing. Loved the course and the swag! The first medal with a moving part in it. Will run next year too.
Spirit of Wipro Run – 5K, Dallas, TX – 21st September 2025
This wasn’t a competitive race so, no medals! The main goal was to introduce Ashvik to running. The planned distance was 1K, but my Garmin showed we actually covered 1.5K.
Since it was his very first race, I ran alongside him (a little off to the side) but close enough to offer support, but far enough to let him do it on his own. The run started pretty late at 9 a.m. CT, and with September still feeling like summer, Ashvik needed a few sips of water on his way back to the finish line.
I was pleasantly surprised he completed the full distance in around 15 minutes! He used a walk–run–walk–run rhythm, keeping the walking to a very minimum so he could finish strong. The only disappointment for him? No medal at the finish line! Even I was very disappointed as Wipro made us design medals and stuff.
After his run, he got to enjoy his favorite bounce house, while I did my “5K” (which was closer to 3.xK in and finished in 20min 22sec. The best part? We all got to wear the same event T-shirt (mom-dad and Ashvik), which made it feel like a real family day out.
Hay Day Hustle – Fun Run, Dallas, TX – 11th October 2025
The Hay Day Hustle 5K is a festive, fall-themed race and 1-mile fun run held at the UNT Dallas campus, along the scenic and flat Runyon Creek Trail in Dallas, Texas. The main reason I chose this event was to get Ashvik the medal he missed in his previous race, the Wipro Run.
The weather was perfect, the crowd was wonderful, and there were plenty of kids around Ashvik’s age. Best of all, the run took place entirely within the UNT campus, with officers and volunteers stationed along the route to ensure everyone’s safety. That gave me the confidence to let Ashvik run on his own this time; after cheering him through the first 100 meters, I watched from the sidelines.
He completed the mile in under 15 minutes — an incredible achievement for a 5-year-old with no formal training!
I couldn’t run the 5K myself since there wasn’t anyone to watch Ashvik, so instead we spent some time at the kids’ bounce house near the start line. He jumped and played happily, showing no signs of fatigue from his run.
The highlight of the day? Seeing his excitement when he received his medal. I just cannot express how excited he was to get his medal and proudly hang it beside mine on our medal hangar at home.
Spartan Sprint 5K – Granbury, TX – 18th October 2025
My first Obstacle Course Race (OCR) was a wild ride! The event was held about 100 miles from home at the beautiful Twin Canyons Ranch Resort in Granbury, TX. The location was absolutely perfect for this kind of grueling race.
My start time was a blistering 12:15 PM slot, right under the blazing sun. To be completely honest, this was one of the most unprepared races I’ve ever done. My “prep” consisted of a few practice burpees and watching some videos to mentally brace myself, that’s it!
I arrived an hour and a half early, checked in to get my headband (14555) and timing chip (Bib #9010410), and headed to the start line. The first shocker hit immediately: to even get to the starting corral, we had to jump a six-foot wall! The initial four obstacles of the twenty on the course felt like a piece of cake. I was feeling strong, cruising through them, and even thought, “I should have signed up for the 10K!” That’s when the race decided to get serious.
The next set of obstacles truly tested me. The bucket carry and the sandbag carry were both on a serious incline, and having to slow down to navigate around struggling fellow Spartans definitely took a toll. When I got to the Atlas carry, I knew I couldn’t lift the stone and was ready for the penalty burpees. But a fellow Spartan stepped in with a brilliant tip: instead of picking the stone, ask a fellow spartan to hand it to me when they are done. This worked! On my way back, there was another spartan who required the same help, so instead of dropping the stone after my turn, I passed it to the next person in line to take it directly from me. That simple act made it easier on my back and let me pay the favor forward by happily handing the stone off to the next racer. That camaraderie was the best part!
Multi-rigAtlas carrySandbagBucketFinish line
The spear throw was a flop, which meant a penalty of 30 burpees right there! I also had to take a penalty loop for the Hercules Hoist; that heavy bag felt like it weighed more than I do.
One of my biggest fears going into the race was having to plunge into dirty, cold water, but thankfully, the 5K course didn’t have a water-dip obstacle! The course itself was a bit slushy from the rain the day before, but I have zero complaints about the conditions.
I crossed the finish line with an official time of 1 hour 38 minutes 36 seconds. I know I could have done a lot better, but for an utterly unprepared first attempt, I’m proud!
Next year, you can bet I’ll be going in with a much better plan of attack and better prepared for every single obstacle.
Ended 2025 with 5 runs. Better than 2024. In 2026, going to double down on my Spartan race.
Hot Chocolate Run – 10K, Dallas, TX – 7th February 2026
This was my fourth Hot Chocolate run. Yes, the chocolate was my primary motivator again this year.
Race morning brought bright sunshine, temperatures around 10 °C, and a gentle breeze. Ideal conditions. I appreciated the later start time at 8:30 AM instead of the usual 7:00 AM, and the organizers gave 5K runners a 7:30 AM start with the option to continue into the 10K.
On preparation, I’ll be honest: this time I didn’t put in enough practice runs in the weeks leading up to the race, and I wasn’t disciplined about my eating in the days before. The result showed in my timing, not bad, but not what I might have achieved with better prep. With Bib #30041, I finished in 57:08 (pace: 9:12 min/mi).
Fair Park offered ample parking, the crowd energy was strong, and overall it was another solid run.