
What If You Could See Your Company’s Thinking?
Lessons from a Personal Thought Map
I recently mapped all my LinkedIn posts (since Jan 2025) into a graph using Obsidian. What emerged is a working model of how ideas evolve, connect, and compound over time. You can interact with the live “thought map” at the link below to see this logic in practice.
https://portfolio.jkspeaks.com/thought-map.html
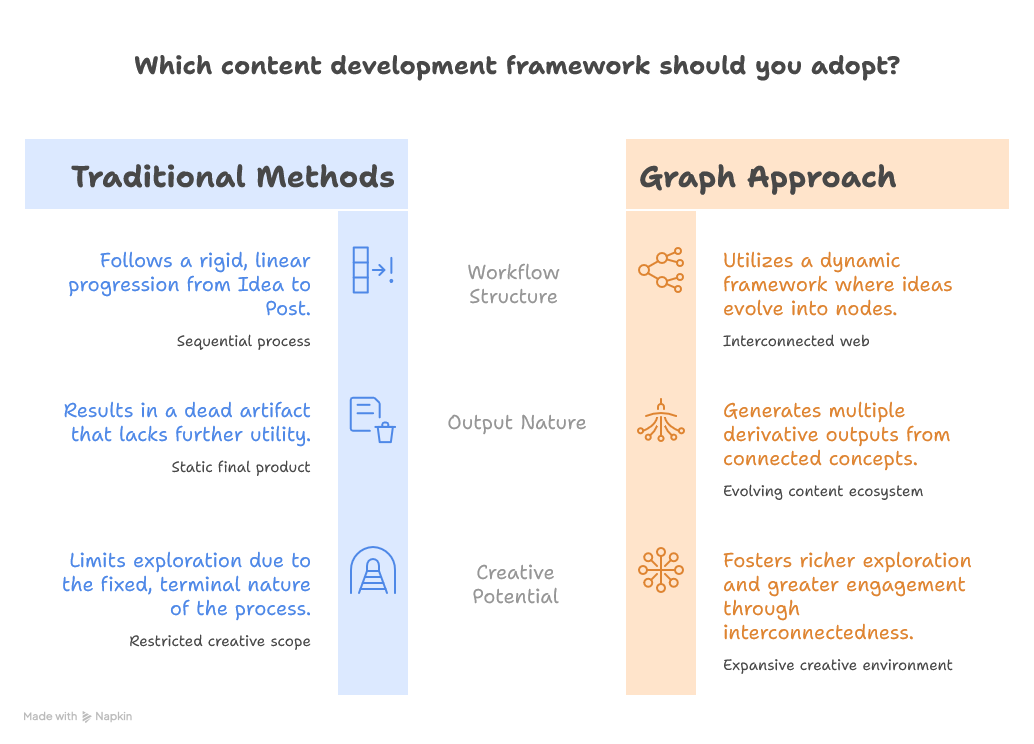
Most of us treat content as a linear archive:
Post → Publish → Move on
But a relational knowledge graph changes the fundamental ROI of your intellectual capital. It turns static information (e.g., PDFs, docs, posts) into a navigable system of enterprise thinking. For example,
- Nodes become concepts, ideas, and strategic positions.
- Edges reveal relationships – explicit or semantic.
- Clusters show recurring narratives.
- Isolated nodes highlight one-offs or underdeveloped thinking.
In short, it surfaces the latent knowledge structure beneath the surface: how your thinking is actually organized or operating.
What this enables (and why it matters for enterprises)
When we visualize knowledge as a graph, the metrics for “content” shift toward “strategy”:
Thematic Concentration vs. Noise: By analyzing the density of clusters, leadership can move beyond asking “what have we produced?” to “what is our actual strategic narrative?” It allows you to see if your organization is building a coherent, ownable perspective or simply generating disconnected noise.
In my example, instead of asking “what have I published?” I can ask:
- Where are the densest clusters? → core strategic themes
- What’s weakly connected? → noise or experimentation
- What’s missing between clusters? → synthesis gaps
For me, this quickly surfaced 3–5 consistent themes that define my point of view.
Detecting white space
Graphs are uniquely capable of surfacing what is missing. Clusters that sit close but remain unconnected (e.g., “Product Innovation” and “Operational Risk”) indicate you have identified a prime opportunity for cross-functional synthesis and immediate innovation opportunities. Similarly, depth without breadth indicates there is a potential risk of siloed thinking. Another example: absent industry adjacencies could indicate potential relevance gaps.
For enterprises, this becomes a structural, data-driven input into their content, innovation, and strategy roadmaps, grounded in the actual shape of their institutional knowledge.
Building an idea supply chain
In a traditional setting, an idea is a one-time output. In a graph, a single node such as GraphRAG can be branched into architectural implications, organizational design impacts, and enterprise readiness models. This creates a compounding asset where every new piece of thinking adds exponential value to the existing structure.
A Personal Revelation on Evolution
One of the most striking realizations during this process was seeing the visual evolution of my own “writing phases.” In a flat list, my posts looked like a chronological sequence. In the graph, I could see the exact moment my focus shifted from tactical experimentation to broader advisory frameworks. I could physically see my thinking maturing, as older nodes began to anchor newer, more complex clusters.
Additionally, I am able to query across posts with ease:
- Am I evolving or just repeating?
- Are my ideas converging into a stronger thesis?
- Where am I inconsistent?
- What is actually differentiated in my thinking?
All while consuming fewer tokens as the entire post is not sent to the LLM. Only the context is sent. This matters a lot when we are talking about thousands of documents in a typical enterprise scenario.
For an enterprise, this is the ultimate diagnostic. It allows you to audit intellectual consistency: Are your teams evolving over time, or are they trapped in a cycle of repetition?
Moving Toward a Knowledge Graph-Based Model
For the modern leader, this pattern generalizes across the entire business architecture. Strategy documents, business capabilities, and operating models are not separate entities. They are interconnected nodes, while dependencies become the edges and operating model becomes the clusters. By layering LLMs over this structured “scaffolding,” we enable multi-hop reasoning and high-signal retrieval that allows even smaller, specialized models to deliver outsized intelligence.
We are entering an era where the competitive advantage will no longer belong to the organization with the most data but to the one that understands the structural shape of its own intelligence.
A simple diagnostic framework
If you mapped your organization’s thinking today, four signals would stand out:
- Thematic concentration: Are nodes clustered around a few core ideas, or scattered?
- Depth vs. breadth: Do your key strategic bets have rich connections?
- Evolution over time: Do new initiatives build on prior knowledge or reset?
- Differentiation: Does the graph reveal a unique point of view or mostly industry echo?
The deeper question this leaves me with:
What would your organization’s graph look like? Would it show a coherent strategic architecture that compounds over time? Or would you see a collection of disconnected initiatives waiting for a bridge that hasn’t been built yet?
The gap between the two is where real enterprise advantage is built.
#AgenticAI #EnterpriseAI #KnowledgeGraphs #GraphRAG #AIArchitecture #DataStrategy #EnterpriseArchitecture #KnowledgeManagement #DigitalTransformation