Organizations frequently discuss the importance of data quality and its impact on business value. Even the most sophisticated analytical models falter with outdated and unreliable data, resulting in misleading recommendations, inaccurate forecasts, suboptimal business decisions, and wasted resources.
In today’s data-driven world, organizations face information overload, often storing vast amounts of data without considering its diminishing relevance. While some clients recognize this “information overload” and exercise caution regarding what they capture, others maintain the status quo, leading to increased costs, flawed insights, low customer satisfaction, and poor performance.
“What goes into production environment, stays there.”
“As per regulations, we need to store 7 years of data. But we only flag records. Do not delete them!”
Organizations must understand that the value of data is not static; it evolves and degrades over time. This understanding is crucial for accurate analysis and effective decision-making. In fact, one dimension of quality is timeliness, which translates to the lifetime value of data or data aging. This article explores the concept of ‘data aging’ and its implications for the success of data-driven initiatives.
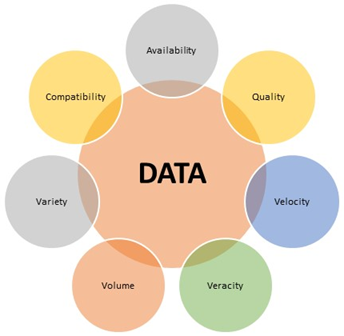
The four dimensions of data
To calculate the lifetime validity of data, one must understand the four dimensions of data, commonly referred to as the 4V’s: Volume (Vo), Velocity (Ve), Variety (Va), and Veracity (Vr). The first three—Volume, Velocity, and Variety—are straightforward.
Dimension
Description
Volume (Vo)
The sheer amount/quantity of data from various sources. E.g., transactions, logs.
Velocity (Ve)
The speed at which data is generated and processed. Also known as the rate of data flow. E.g., real-time, batch.
Variety (Va)
The diverse forms/types of data. E.g., structured, semi-structured, and unstructured data.
Veracity (Vr)
The reliability and trustworthiness of data. E.g., accuracy, consistency, conformity.
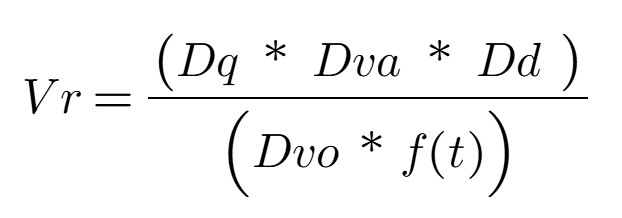
Let’s focus on the fourth V, Veracity (Vr) which encompasses the accuracy and truthfulness aspects of data. Veracity is a function of four components that directly influence the insights and Business Value (Bv) generated.
This equation represents a more traditional view and emphasizes the fundamental aspects of data veracity: data quality, data value, data density, data volatility, and the impact of time. This equation is suitable for situations where the dataset is small and data volume, velocity, and variety are relatively stable or not significant factors. In short, the focus is on the intrinsic quality and reliability of the data.
The components explained:
Quality of Data (Dq): A normalized quantitative score, derived from a comprehensive data profiling process, serves as a measure of data quality (Dq). This score encapsulates the 4Cs: completeness, correctness, clarity, and consistency.
Data Volatility (Dvo): Refers to the duration for which the data or dataset remains relevant. It quantifies the spread and variability of data points, extending beyond mere temporal change. While some define volatility as the rate of data change, this definition emphasizes the overall fluctuation, i.e., rate at which data changes[1]. For example, customer preferences. A numerical scale, such as 1 to 10, can be used to represent the spectrum from low to high volatility.
Data Value (Dva): Represents the actionable insights, cost savings, or value of derived knowledge obtained through analytical modeling, such as correlation and regression. In essence, it answers the question, “What is the practical significance of this data analysis?” A numerical scale, such as 1 to 10, can be used to represent the range from low to high data value.
Quality of Data Density (Dd): Measures the concentration of valuable, complete, and relevant information within a dataset. It emphasizes the presence of meaningful data, rather than sheer volume. For example, a dataset with numerous entries but missing essential fields exhibits low data density quality. This assessment is determined through a combination of data profiling and subject matter expert (SME) evaluation.
Computing the lifetime value using Vr
All the above components are time-dependent, and any equation involving time will have an associated lifetime or value. Hence, the value of data either remains constant (for a period) or degrades over time, depending on the type of data. Now, let us integrate the 3Vs (Volume, Velocity and Variety) into this equation (Vr).
To briefly explain, data quality, value, and density are in the numerator because high values for these components improve data reliability. The other components negatively impact trustworthiness with higher values and are therefore in the denominator. To tailor the equation to specific use cases, weight coefficients can be incorporated to reflect the relative importance of each factor. These weights should be adjusted based on the unique context or requirements of the analysis. Generally, a lower overall score indicates that the data is aged, exhibits reduced stability, and/or possesses diminished reliability. This characteristic can be particularly valuable in scenarios where historical trends and patterns hold greater significance than contemporary data, such as retrospective studies or long-term trend analyses.
Real-world examples
Consider customer purchasing behavior data. Companies utilize segmentation and personalization based on customer lifecycle stages for targeted marketing. As individuals transition through life stages, their purchasing patterns evolve. Consequently, relying on data from a specific historical point—such as during a period of job searching, financial dependence, or early adulthood—to predict purchasing behavior during a later stage of financial independence, high-income employment, family life, or mid-adulthood is likely to produce inaccurate results.
Similarly, credit rating information demonstrates the impact of data aging. Financial institutions typically prioritize a customer’s recent credit history for risk assessment. A credit rating from an individual’s early adulthood is irrelevant for risk calculations in their mid-40s. These examples underscore the principle of data aging and its implications for analytical accuracy.
Strategies for mitigating the effects of data aging
Data Governance: Establishing clear data retention and data quality standards.
Data Versioning (by customer stages): Tracking changes to data over time to understand its evolution.
AI Infusion: Utilizing AI at every stage of the data lifecycle to identify and address data anomalies, inconsistencies and data decay.
Conclusion
The truth is, data isn’t static. It’s a living, breathing entity that changes over time. Recognizing and adapting to these changes is what separates effective data strategies from those that quickly become obsolete. If you found this post insightful, please comment below! In a future post, I will explore the impact of other components like data gravity and data visualization on business value. Let me know if that’s something you’d like to see!
Reference:
“The Importance of Data Quality in a Data-Driven World” by Gartner (2023)
“Data Decay: Why Your Data Isn’t as Good as You Think It Is” by Forbes (2022)
McKinsey & Company, “The Age of Analytics: Competing in a Data-Driven World” (2023)
Deloitte Insights, “Data Valuation: Understanding the Value of Your Data Assets” (2022)
[1] “rate of change of data” is typically represented as a derivative in mathematics. It gives a precise value showing how one variable changes in relation to another (e.g., how temperature changes with time). “rate at which data changes” emphasizes the speed or pace at which the data is changing over time (pace of data variation).
To keep pace with ever-present business and technology change and challenges, organizations need operating models built with a strong data and analytics foundation. Here’s how your organization can build one incorporating a range of key components and best practices to quickly realize your business objectives.
Executive Summary
To succeed in today’s hypercompetitive global economy, organizations must embrace insight-driven decision-making. This enables them to quickly anticipate and enforce business change with constant and effective innovation that swiftly incorporates technological advances where appropriate. The pivot to digital, consumer-minded new regulations around data privacy and the compelling need for greater levels of data quality together are forcing organizations to enact better controls over how data is created, transformed, stored and consumed across the extended enterprise. Chief data/analytics officers who are directly responsible for the sanctity and security of enterprise data are struggling to bridge the gap between their data strategies, day-to-day operations and core processes. This is where an operating model can help. It provides a common view/definition of how an organization should operate to convert its business strategy to operational design. While some mature organizations in heavily regulated sectors (e.g., financial services), and fast-paced sectors (e.g., retail) are tweaking their existing operating models, younger organizations are creating operating models with data and analytics as the backbone to meet their business objectives. This white paper provides a framework along with a set of must-have components for building a data and analytics operating model (or customizing an existing model).
The starting point: Methodology
Each organization is unique, with its own specific data and analytics needs. Different sets of capabilities are often required to fill these needs. For this reason, creating an operating model blueprint is an art, and is no trivial matter. The following systematic approach to building it will ensure the final product works optimally for your organization. Building the operating model is a three-step process starting with the business model (focus on data) followed by operating model design and then architecture. However, there is a precursory step, called “the pivots,” to capture the current state and extract data points from the business model prior to designing the data and analytics operating model. Understanding key elements that can influence the overall operating model is therefore an important consideration from the get-go (as Figure 1 illustrates). The operating model design focuses on integration and standardization, while the operating model architecture provides a detailed but still abstract view of organizing logic for business, data and technology. In simple terms, this pertains to the crystallization of the design approach for various components, including the interaction model and process optimization.
Preliminary step: The pivots
No two organizations are identical, and the operating model can differ based on a number of parameters — or pivots — that influence the operating model design. These parameters fall into three broad buckets:
Design principles: These set the foundation for target state definition, operation and implementation. Creating a data vision statement, therefore, will have a direct impact on the model’s design principles. Keep in mind, effective design principles will leverage all existing organizational capabilities and resources to the extent possible. In addition, they will be reusable despite disruptive technologies and industrial advancements. So these principles should not contain any generic statements, like “enable better visualization,” that are difficult to measure or so particular to your organization that operating-model evaluation is contingent upon them. The principles can address areas such as efficiency, cost, satisfaction, governance, technology, performance metrics, etc.
Sequence of operating model development
Current state: Gauging the maturity of data and related components — which is vital to designing the right model — demands a two-pronged approach: top down and bottom up. The reason? Findings will reveal key levers that require attention and a round of prioritization, which in turn can move decision-makers to see if intermediate operating models (IOMs) are required.
Influencers: Influencers fall into three broad categories: internal, external and support. Current-state assessment captures these details, requiring team leaders to be cognizant of these parameters prior to the operating-model design (see Figure 2). The “internal” category captures detail at the organization level. ”External” highlights the organization’s focus and factors that can affect the organization. And “support factor” provides insights into how much complexity and effort will be required by the transformation exercise.
Operating model influencers
First step: Business model
A business model describes how an enterprise leverages its products/services to deliver value, as well as generate revenue and profit. Unlike a corporate business model, however, the objective here is to identify all core processes that generate data. In addition, the business model needs to capture all details from a data lens — anything that generates or touches data across the entire data value chain (see Figure 3). We recommend that organizations leverage one or more of the popular strategy frameworks, such as the Business Model Canvas1 or the Operating Model Canvas,2 to convert the information gathered as part of the pivots into a business model. Other frameworks that add value are Porter’s Value Chain3 and McKinsey’s 7S framework.4 The output of this step is not a literal model but a collection of data points from the corporate business model and current state required to build the operating model.
Second step: Operating model
The operating model is an extension of the business model. It addresses how people, process and technology elements are integrated and standardized.
Integration: This is the most difficult part, as it connects various business units including third parties. The integration of data is primarily at the process level (both between and across processes) to enable end-to-end transaction processing and a 360-degree view of the customer. The objective is to identify the core processes and determine the level/type of integration required for end-to-end functioning to enable increased efficiency, coordination, transparency and agility (see Figure 4). A good starting point is to create a cross-functional process map, enterprise bus matrix, activity based map or competency map to understand the complexity of core processes and data. In our experience, tight integration between processes and functions can enable various functionalities like self-service, process automation, data consolidation, etc.
The data value chain
Standardization: During process execution, data is being generated. Standardization ensures the data is consistent (e.g., format), no matter where (the system), who (the trigger), what (the process) or how (data generation process) within the enterprise. Determine what elements in each process need standardization and the extent required. Higher levels of standardization can lead to higher costs and lower flexibility, so striking a balance is key.
Integration & standardization
Creating a reference data & analytics operating model
The reference operating model (see Figure 5) is customizable, but will remain largely intact at this level. As the nine components are detailed, the model will change substantially. It is common to see three to four iterations before the model is elaborate enough for execution.
For anyone looking to design a data and analytics operating model, Figure 5 is an excellent starting point as it has all the key components and areas.
Final step: Operating model architecture
Diverse stakeholders often require different views of the operating model for different reasons. As there is no one “correct” view of the operating model, organizations may need to create variants to fulfill everyone’s needs. A good example is comparing what a CEO will look for (e.g., strategic insights) versus what a CIO or COO would look for (e.g., an operating model architecture). To accommodate these variations, modeling tools like Archimate5 will help create those different views quickly. Since the architecture can include many objects and relations over time, such tools will help greatly in maintaining the operating model. The objective is to blend process and technology to achieve the end objective. This means using documentation of operational processes aligned to industry best practices like Six Sigma, ITIL, CMM, etc. for functional areas. At this stage it is also necessary to define the optimal staffing model with the right skill sets. In addition, we take a closer look at what the organization has and what it needs, always keeping value and efficiency as the primary goal. Striking the right balance is key as it can become expensive to attain even a small return on investment. Each of the core components in Figure 5 needs to be detailed at this point, in the form of a checklist, template, process, RACIF, performance metrics, etc. as applicable – the detailing of three subcomponents one level down. Subsequent levels involve detailing each block in Figure 6 until task/activity level granularity is reached.
Reference data & analytics operating model (Level 1)
The operating model components
The nine components shown in Figure 5 will be present in one form or another, regardless of the industry or the organization of business units. Like any other operating model, the data and analytics model also involves people, process and technology, but from a data lens.
Component 1: Manage process: If an enterprise-level business operating model exists, this component would act as the connector/ Component 1: Manage Process: If an enterpriselevel business operating model exists, this component would act as the connector/bridge between the data world and the business world. Every business unit has a set of core processes that generate data through various channels. Operational efficiency and the enablement of capabilities depend on the end-to-end management and control of these processes. For example, the quality of data and reporting capability depends on the extent of coupling between the processes.
Component 2: Manage demand/requirements & manage channel: Business units are normally thirsty for insights and require different types of data from time to time. Effectively managing these demands through a formal prioritization process is mandatory to avoid duplication of effort, enable faster turnaround and direct dollars to the right initiative.
Sampling of subcomponents: An illustrative view
Component 3: Manage data: This component manages and controls the data generated by the processes from cradle to grave. In other words, the processes, procedures, controls and standards around data, required to source, store, synthesize, integrate, secure, model and report it. The complexity of this component depends on the existing technology landscape and the three v’s of data: volume, velocity and variety. For a fairly centralized or single stack setup with a limited number of complementary tools and technology proliferation, this is straightforward. For many organizations, the people and process elements can become costly and time-consuming to build.
To enable certain advanced capabilities, the architect’s design and detail are major parts of this component. Each of the five subcomponents requires a good deal of due diligence in subsequent levels, especially to enable “as-aservice” and “self-service” capabilities.
Component 4a: Data management services: Data management is a broad area, and each subcomponent is unique. Given exponential data growth and use cases around data, the ability to independently trigger and manage each of the subcomponents is vital. Hence, enabling each subcomponent as a service adds value. While detailing the subcomponents, architects get involved to ensure the process can handle all types of data and scenarios. Each of the subcomponents will have its set of policy, process, controls, frameworks, service catalog and technology components.
Enablement of some of the capabilities as a service and the extent to which it can operate depends on the design of Component 3. It is common to see a few IOMs in place before the subcomponents mature.
Component 4b: Data analytics services: Deriving trustable insights from data captured across the organization is not easy. Every organization and business unit has its requirement and priority. Hence, there is no one-size-fits-all method. In addition, with advanced analytics such as those built around machine-learning (ML) algorithms, natural language processing (NLP) and other forms of artificial intelligence (AI), a standard model is not possible. Prior to detailing this component, it is mandatory to understand clearly what the business wants and how your team intends to deliver it. Broadly, the technology stack and data foundation determine the delivery method and extent of as-a-service capabilities.
Similar to Component 4a, IOMs help achieve the end goal in a controlled manner. The interaction model will focus more on how the analytics team will work with the business to find, analyze and capture use cases/requirements from the industry and business units. The decision on the setup — centralized vs. federated — will influence the design of subcomponents.
Business units are normally thirsty for insights and require different types of data from time to time. Effectively managing these demands through a formal prioritization process is mandatory to avoid duplication of effort, enable faster turnaround and direct dollars to the right initiative.
Component 5: Manage project lifecycle: The project lifecycle component accommodates projects of Waterfall, Agile and/or hybrid nature. Figure 5 depicts a standard project lifecycle process. However, this is customizable or replaceable with your organization’s existing model. In all scenarios, the components require detailing from a data standpoint. Organizations that have an existing program management office (PMO) can leverage what they already have (e.g., prioritization, checklist, etc.) and supplement the remaining requirements.
The interaction model design will help support servicing of as-a-service and on-demand data requests from the data and analytics side during the regular program/project lifecycle.
Component 6: Manage technology/ platform: This component, which addresses the technology elements, includes IT services such as shared services, security, privacy and risk, architecture, infrastructure, data center and applications (web, mobile, on-premises).
As in the previous component, it is crucial to detail the interaction model with respect to how IT should operate in order to support the as-aservice and/or self-service models. For example, this should include cadence for communication between various teams within IT, handling of live projects, issues handling, etc.
Component 7: Manage support: No matter how well the operating model is designed, the human dimension plays a crucial role, too. Be it business, IT or corporate function, individuals’ buy-in and involvement can make or break the operating model.
The typical support groups involved in the operating-model effort include BA team (business technology), PMO, architecture board/group, change management/advisory training and release management teams, the infrastructure support group, IT applications team and corporate support group (HR, finance, etc.). Organization change management (OCM) is a critical but often overlooked component. Without it, the entire transformation exercise can fail.
Component 8: Manage change: This component complements the support component by providing the processes, controls and procedures required to manage and sustain the setup from a data perspective. This component manages both data change management and OCM. Tight integration between this and all the other components is key. Failure to define these interaction models will result in limited scalability, flexibility and robustness to accommodate change.
The detailing of this component will determine the ease of transitioning from an existing operating model to a new operating model (transformation) or of bringing additions to the existing operating model (enhancement).
Component 9: Manage governance: Governance ties all the components together, and thus is responsible for achieving the synergies needed for operational excellence. Think of it as the carriage driver that steers the horses. Although each component is capable of functioning without governance, over time they can become unmanageable and fail. Hence, planning and building governance into the DNA of the operating model adds value.
The typical governance areas to be detailed include data/information governance framework, charter, policy, process, controls standards, and the architecture to support enterprise data governance
Intermediate operating models (IOMs)
As mentioned above, an organization can create as many IOMs as it needs to achieve its end objectives. Though there is no one right answer to the question of optimal number of IOMs, it is better to have no more than two IOMs in a span of one year, to give sufficient time for model stabilization and adoption. The key factors that influence IOMs are budget, regulatory pressure, industrial and technology disruptions, and the organization’s risk appetite. The biggest benefit of IOMs lies in their phased approach, which helps balance short-term priorities, manage risks associated with large transformations and satisfy the expectation of top management to see tangible benefits at regular intervals for every dollar spent.
IOMs help achieve the end goal in a controlled manner. The interaction model will focus more on how the analytics team will work with the business to find, analyze and capture use cases/ requirements from the industry and business units. The decision on the setup – centralized vs. federated – will influence the design of subcomponents.
DAOM (Level 2)
To succeed with IOMs, organizations need a tested approach that includes the following critical success factors:
Clear vision around data and analytics.
Understanding of the problems faced by customers, vendors/suppliers and employees.
Careful attention paid to influencers.
Trusted facts and numbers for insights and interpretation.
Understanding that the organization cannot cover all aspects (in breadth) on the first attempt.
Avoidance of emotional attachment to the process, or of being too detail-oriented.
Avoidance of trying to design an operating model optimized for everything.
Avoidance of passive governance — as achieving active governance is the goal.
Methodology: The big picture view
Moving forward
Two factors deserve highlighting: First, as organizations establish new business ventures and models to support their go-to-market strategies, their operating models may also require changes. However, a well-designed operating model will be adaptive enough to new developments that it should not change frequently. Second, the data-to-insight lifecycle is a very complex and sophisticated process given the constantly changing ways of collecting and processing data. Furthermore, at a time when complex data ecosystems are rapidly evolving and organizations are hungry to use all available data for competitive advantage, enabling things such as data monetization and insight-driven decisionmaking becomes a daunting task. This is where a robust data and analytics operating model shines. According to a McKinsey Global Institute report, “The biggest barriers companies face in extracting value from data and analytics are organizational.”6 Hence, organizations must prioritize and focus on people and processes as much as on technological aspects. Just spending heavily on the latest technologies to build data and analytics capabilities will not help, as it will lead to chaos, inefficiencies and poor adoption. Though there is no one-sizefits-all approach, the material above provides key principles that, when adopted, can provide optimal outcomes for increased agility, better operational efficiency and smoother transitions.
Endnotes
1 A tool that allows one to describe, design, challenge and pivot the business model in a straightforward, structured way. Created by Alexander Osterwalder, of Strategyzer. 2 Operating model canvas helps to capture thoughts about how to design operations and organizations that will deliver a value proposition to a target customer or beneficiary. It helps translate strategy into choices about operations and organizations. Created by Andrew Campbell, Mikel Gutierrez and Mark Lancelott. 3 First described by Michael E. Porter in his 1985 best-seller, Competitive Advantage: Creating and Sustaining Superior Performance. This is a general-purpose value chain to help organizations understand their own sources of value — i.e., the set of activities that helps an organization to generate value for its customers. 4 The 7S framework is based on the theory that for an organization to perform well, the seven elements (structure, strategy, systems, skills, style, staff and shared values) need to be aligned and mutually reinforcing. The model helps identify what needs to be realigned to improve performance and/or to maintain alignment. 5 ArchiMate is a technical standard from The Open Group and is based on the concepts of the IEEE 1471 standard. This is an open and independent enterprise architecture modeling language. For more information: www.opengroup.org/subjectareas/enterprise/archimate-overview. 6 The age of analytics: Competing in a data-driven world. Retrieved from www.mckinsey.com/~/media/McKinsey/Business%20Functions/McKinsey%20Analytics/Our%20Insights/The%20age%20of%20analytics%20Competing%20in%20a%20data%20driven%20world/MGI-The-Age-of-Analytics-Full-report.ashx
How many times have we gone through the routine of seeing data issue after data issue when something goes live in production, no matter how much of due-diligence was put in place? Despite having industry leading frameworks, operating models, air-tight processes, best-in-class templates, data issues creep in at multiple touch-points. Based on my assessment of UAT/post Go-Live scenario at various clients, more than 60% of the issues faced is related to data. Some of the organizations assessed had some sort of a piecemeal approach (or a quick fix in their parlance) to reduce data issues but it was more reactive and not sufficient, foolproof, scalable and/or repeatable.
The project types assessed include data migration, data integration, data transformation and creating/enhancing a bunch of analytical reports. In all the scenarios, data issue topped the charts as the number one pain area to be addressed. This is because the “data” aspect was either overlooked or not given the required level of importance. None of the processes were designed keeping data as the core/foundation. Everyone understands that data is an asset, yet no one has designed the frameworks models and processes keeping data as the key focus. It is just one module or component in the entire spectrum of things. Addressing all aspects around data in a systematic manner in addition to the existing parameters is key to reducing data issues.
Figure: 1 – Key areas around data
Figure 1 shows some of the key areas that need to be addressed around data as a bare minimum to reduce data related issues.
A conceptual “Data Readiness” framework that can be customized and scaled up as required to suit various project types is shown here. Conducting an end-to-end data readiness check using such a well-defined framework, covering all major touch-points for data will help address data related issues early. While this framework is predominantly helpful during the approval/kick-off phase of projects, it extends all the way till the project goes live and declared stable.
Figure: 2 – Base framework for Data readiness
This highly scalable and customizable framework comes with supporting artifact(s) for each area as applicable. Refer Figure 3 for details. These artifacts are spread across people, process and technology areas. This will automatically address issues like schedule overruns, cost overruns, rework, low user confidence on IT, etc. as it touches upon all the aspects related to data.
The biggest advantage of this framework is that it can be easily blended with any existing governance model and PMO model an organization might be following.
The selling of assets, divisions, or subsidiaries to another corporation or individual(s) is termed divestiture. According to a divestiture survey conducted by Deloitte, “the top reason for divesting a business unit or segment is that it is not considered core to the company’s business strategy” and “the need to get rid of non-core assets or financing needs as their top reason for divesting an asset”. In some cases, divestiture is done to de-risk the parent company from a high-potential but risky business line or product line. Economic turnaround and a wall of capital also drive the demand for divestitures.
Divestitures have some unique characteristics that distinguish them from other M&A transactions and spin-offs. For example, the need to separate (aka disentangle) business and technology assets of the unit being sold from that of the seller before the sale is executed. Performing the disentanglement under tighter time constraints, i.e. before the close of the transaction, unlike in the case of an acquisition scenario adds to the complexity.
The critical aspect of the entire process is data disposition. Though similar technologies could have been deployed on the buyer and seller side, the handover can end up painful if a formal process is not adopted right from the due-diligence phase. This is because, in the case of divestiture, the process is not as simple as a ‘lift-shift and operate’ process. There is a hand full of frameworks available in the market detailing the overall process in a divestiture scenario nevertheless the core component which is “data” is touched upon at the surface level and not expanded enough to throw light on the true complexities involved.
What does the trend indicate?
Divestitures and carve-outs are very common in Life Science, Retail and Manufacturing.
If we observe the economic movements and divestiture trend over the past decade, it is clear that the economic conditions have a direct correlation and significant impact on divestiture. So organizations have to proactively start assessing their assets at least annually to understand which assets are potential candidates for divestitures and prepare for the same. This way, when the time is right the organization would be well prepared for the transition services agreement (TSA) phase.
The bottom-line
Overall planning is a critical success factor, however, that process not involving sufficient planning around the “data” component can result in surprises at various points during the course of divestiture and even end up in breaking the deal. End of the day the shareholders and top management will only look at the data to say if the deal was successful or not.
Faster due-diligence, quicker integration, and visible tracking of key metrics/milestones from the start is what one looks for. As per industry experts, having a proactive approach in place has helped sellers to increase the valuation of the deal.
One of the key outputs of this framework is a customized technology and data roadmap. This roadmap will contain recommendations and details around the data and technology complexities that need to be addressed prior to, during, and post the divestiture to ensure a higher success rate for both the selling and buying organization.
The Divestiture Model – Buyer and Seller Perspective
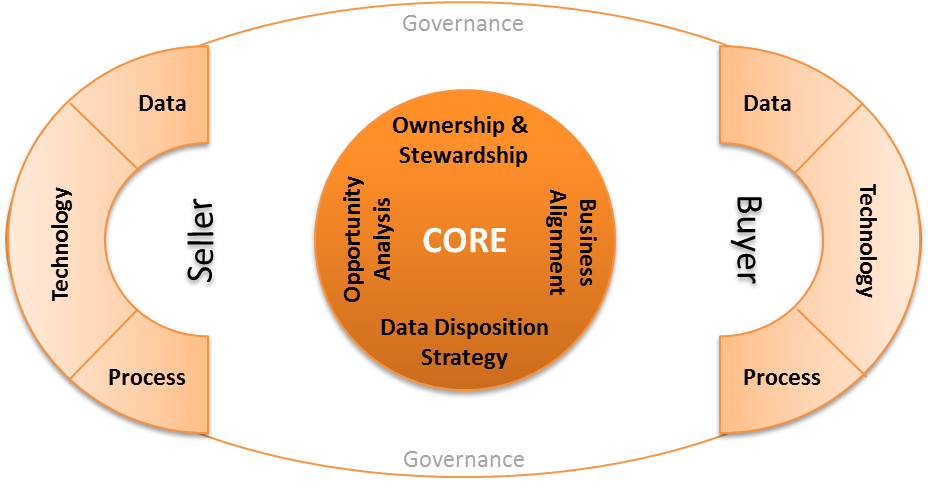
Broadly the Divestiture model has three components: Core, Buyer, and Seller:
Core component: Handles all activities related to overall due-diligence related to data such as identifying data owners and stewards, data disposition strategy, value creation opportunity (VCO), and enterprise-level data integration with core applications at the buyer and seller end.
Seller component: Focuses on seller side activities related to data like data inventory, business metadata documentation, data lineage/dependency, business process, data flow/process flow diagrams and level of integration with enterprise apps, business impact on existing processes, and resource movement (technology and people).
Buyer component: Focuses on buyer-side activities related to data like data mapping, data integration, data quality, technology, capacity planning, and business process alignment.
Governance: The entire process is governed by a 360-degree data/information governance framework to maintain the privacy, security, regulatory, and integrity aspects of data between the two organizations.
Divestiture model – The Core
Addressing the “data” component:
Selling Organization
Only a few sellers understand the fact that just getting a deal signed and closed isn’t always the end. From a pre-divestiture perspective, the organization should have a well-defined process for possible carve-outs, a good data inventory with documented business metadata, documented business processes around the non-performing assets, and a clear data lineage and impact document. Armed with this information, the selling organization can get into any kind of TSA comfortably and answer most of the questions the buyer will raise during their due-diligence.
From a post-divestiture perspective, the selling organization needs to assess what technologies and processes need to be tweaked or decoupled to achieve the company’s post-divestiture strategy. A plan to minimize the impact of operational dependencies on existing systems and processes with enterprise applications like ERP when the data stops coming in. If this was not done thoroughly and analyzed well in advance, it can have a crippling effect on the entire organization. A typical mistake committed by the selling organization is, just looking at the cost savings due to alignment/rationalization of infrastructure and missing the intricate coupling the data has at the enterprise level.
Having a divestiture strategy with data as the core of the framework can address a host of issues for the selling organization and speed up the pace of transactions.
Buying Organization
There could be two potential scenarios when it comes to the buying organization. Either the organization already has the product line or business unit and is looking to enhance its position in the market or the organization is extending itself into a new line of business with no past hands-on experience. In the case of the former, the complexities can be primarily attributed to migration and merging of data between the two organizations. Questions like what data to keep/pull, what technology to use, what data requires cleansing, similarities in processes, capacity planning to house the new data, what tweaks will be required to existing reports, the new reports that need to be created, to show the benefit of the buy to shareholders, etc. arise.
The pre-divestiture stage will address most of the questions raised above and based on the parameters a strategy is drawn for data disposition. During the divestiture stage, when the data disposition is actually happening, new reports, scorecards, and dashboards are built to ensure complete visibility across the organization at every stage of the divestiture process.
In the latter case where the organization is extending itself into a new line of business, questions like should a lift and shift strategy be adopted or should just the key data be brought in, or should it be a start from a clean state, etc. arise. There is no one correct answer for this as it depends on the quality of processes, technology adopted and data coming from the selling organization.
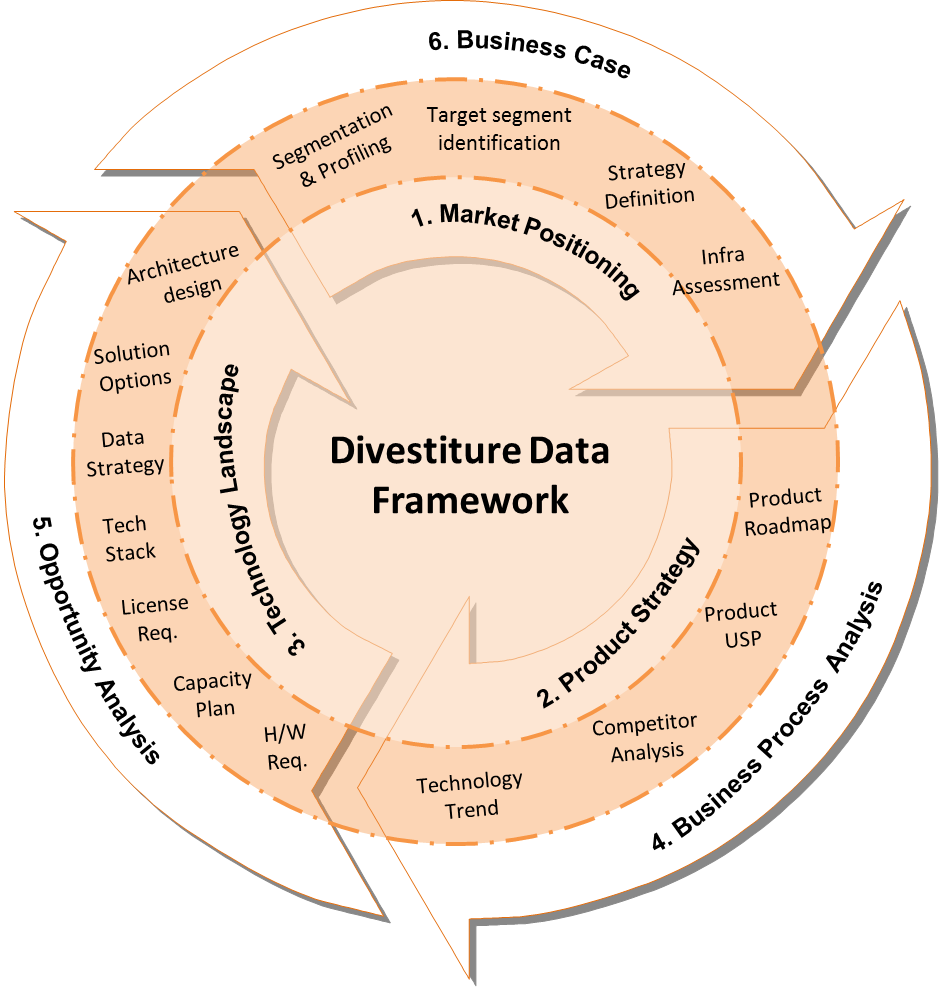
Divestiture Data Framework
The Divestiture Data Framework was designed to highlight the importance of the core component which is “data”.
Divestiture Data Framework
One of the key outputs of this framework is a customized technology and data roadmap. The roadmap will contain recommendations and details around both data and technology complexities that need to be addressed prior to, during, and post the divestiture to ensure a higher success rate for both the selling and buying organization.
As the organization grows organically or in-organically, there will be an infusion of multiple technologies, loss of governance and a drift away from the centralized model. In some organizations where the BI environment is not robust, there will be an increased usage of MS Excel and MS Access to meet various business needs like cross-functional reporting, dashboards, etc.
When the organization is small, one can cater to the business requirements by manually crunching numbers. But as it grows, factors like localization, compliance, availability and skill set of resources make it unmanageable and tedious. Similarly, when the usage of Excel spreadsheets grow the complexity also grows along with it (macros, interlinked excels, etc.)
There are various models and frameworks for rationalization available in the industry today. Each model designed to address a specific problem and offer an excellent short-term solution. Interestingly all these industry models lack two important factors. A governance component and pillars/enablers to sustain the effort and add value to the client.
Rationalization – The piece meal problem:
When the environment slowly starts to become unmanageable, organizations look towards rationalization as a solution. Some of the factors that lead to the need for rationalization are:
Compliance issues
License fees consuming a large portion of the revenue
Consolidation of operations is a bottleneck
Data inconsistency start to creep in
Integration post merger or acquisition
Analysts spending more time validating the data rather than analyzing the information
Generally organizations identify what needs rationalization based on what is impacting their revenue or productivity the most. E.g. Tool license fee. Consultants are then called to fix that particular problem and move on. There are two issues here:
First, the consultant concentrates only on the problem at hand and does not validate the environment for the root cause to fix it permanently
Second, the framework used by the consultant fixes the problem perfectly from a short-term perspective and does not guarantee a long-term solution
The Solution:
Rationalization models in the industry today needs an update for inclusion of a governance component to help assess, rectify and sustain the rationalization effort in the long run. In addition to this, enabling components needs to be identified and included to add value to the overall exercise.
Figure 1
A typical rationalization model with governance component and post rationalization enablers would look as shown in Figure 2. This model is not comprehensive and shows only the most common rationalization scenarios.
Pre-Rationalization Assessment
A pre-assessment when conducted would evaluate if the requested rationalization is all that is required to fix the existing problems or something more is needed for a permanent fix. Typically a root cause analysis helps identify the actual reason behind the current scenario. Along with this, the existing governance maturity and value creation opportunities are also identified to help enhance the user experience, adoption, sustainability and stability of the environment.
A simple excel questionnaire should help initiate the pre-assessment phase (Contact the author if you are interested in this excel) without dwelling deep in trying to understand the intricacies in the environment. Based on the assessment findings, the course of the rationalization exercise can be altered. For example, a formal Data Governance program kicked off in parallel.
Rationalize
This is the phase where the actual rationalization takes place using customized models and frameworks. Complete inventory gathering, metadata analysis, business discussions to understand the needs, etc. is performed. At this point, the client’s need from a short-term perspective is met. Sustainability of the environment would still be questionable.
Governance Component
The depth of coverage for the governance component is to be mutually decided between the client and consultant based on environmental factors. Parameters like size of the IT team, existing processes and policies, maturity, etc. play a major role in deciding the depth required.
The governance component introduced within the rationalization framework would typically deep-dive into the system to understand the policies & standards, roles & responsibilities, etc from various perspectives to fix or find a work-around to the problem and ensure the scenario does not repeat itself.
Enablers
Post rationalization enablers have no dependency on either the rationalization effort or the governance component. This component is kicked off post the rationalization phase either as a separate project or as an extension to the rationalization phase. The enabling components though they are optional, will play a vital role in adding value to the client by sustaining the setup from a long-term perspective and user adoption perspective. On occasions where more than one enabler has been identified, it is sufficient if the key enabler is addressed on priority.
For example, if the client requests for report rationalization, there is a high probability that the data model was not flexible and hence the users were creating multiple reports or there was a training issue. This would have got identified during the pre-assessment phase and can be addressed as part of this phase by setting up something like a Global Report Shop. The governance component would have helped address a part of this issue by ensuring policies are in place to see that the users do not create reports at will and at the same time they are directed to the right team or process to meet their requirements.
Taking another example, if the client goes for a KPI and metrics standardization exercise, there is a good chance that there is a need for data model changes, dashboards to be recreated and analytic reports to be designed from scratch. This can be handled by setting up a core analytics team well in advance. If this was not identified and addressed as part of the KPI standardization project, users day-to-day activities would get hampered and result in poor adoption.
Benefits
Primary advantages of this rationalization model are:
Maximum revenue realization in a short duration
Helps sustain the quality of the environment
Enhances users productivity and adoption
Conclusion
Rationalization must be seen from a broader and long-term perspective. Rationalization without addressing the governance component will not be strong and one without any supporting pillars like the enablers mentioned will not serve the long-term purpose.
Are you faced with questions like, • ‘Consulting – Is it an Expense or an Investment?’
• ‘Strategy – Is it just a jargon or a savior?’
• ‘Roadmap – Is it on track as planned? How do I do a health check?’
Corporates over a period of time had invested a lot of money in various tools and technologies to cater to the needs of various departments within their organization. This has now grown into a mammoth and has started to eat into their profits through licensing costs, maintenance costs, etc. Sometimes one has lost count of the number of application in the landscape, has no clue what a particular application is for, who is using it and why it was needed in the first place? The impact of this has become even more evident especially during the recession period as the IT budgets became slim and expectations from the top management to cut costs increased. The CIO now needs to strategize the IT spends to manage the cost within the budget. This paper tries to address where the CIO can start and how to leverage the services provided by various IT service providers.
Read on to find out how the recession hit industries can leverage the consulting arm of the IT service providers to cut costs and at the same time get a futuristic view of their architecture / approach.
Recession hit Industry:
During recession, quite a few Corporates had employed IT consultants to increase their productivity and cut costs. They achieved this by trying to get a neutral 3rd party view of where they were and what they needed to do next, to sustain themselves during recession. These corporates were primarily looking at consolidation, rationalization and/or optimization of their existing setup and even re-org in some cases.
Situation in the IT Services industry:
IT service providers realized the need for value added services in the market and forayed into the consulting services spectrum during the recession period. This was not set up just to help the clients come out of recession but also to sustain themselves as the IT budgets were growing thin.
In how many cases has one seen the consulting team go back and check what went right or wrong in their proposed recommendation? Even if everything went right, what is the probability that the users have bought into the solution? The problem is really fixed and users are reaping the benefits?
The real problem here is that the consulting and delivery are two separate arms inside the same organization. There are pros & cons to this setup, and yes, they are different beasts. They need to have separate teams, heads, etc. but to achieve the full potential and for the survival of both these arms in the long run, they have to work hand-in-hand. Gone are the days when CIOs just wanted help in ‘doing it’, now they want to have ‘insights’ into what their competitors are doing. This has lead to a very strong and rapid growth in the consulting arm within the IT services organization.
Let’s ask the question, “Can Consulting survive another recession, if it were to happen in the near term?” The answer would be, consulting might not survive as well as it did in the last recession as most of the companies would now have already or just about gone through a fairly large consolidation, rationalization and/or optimization exercise. So in order to survive the next recession, consulting will now have to start looking at new avenues through which it can find in-roads into their clients and keep the consulting arm from taking a hit.
The Solution:
Typically there is a strategy phase and then there is an implementation phase. The missing piece here is a continual monitoring/improvement phase. While consulting arm takes care of the strategic piece and delivery arm takes care of the implementation, the “Extended consulting” will take care of this continual monitoring/improvement phase and also client relationship.
To sustain the consulting industry in the long run, a strong link between the consulting and delivery arm needs to be created now. The result of this link would be a C-D-EC (Consulting – Delivery – Extended consulting/collaboration) model. The advantage here is twofold. One, it helps the consultants provide better recommendations and customize their existing frameworks. Two, after everything is setup, a minor tweak to the original recommendation based on user feedback can go a long way in terms of user buy-in, higher satisfaction levels, etc. One cannot deny the fact that there is a link between the two arms as of today but one has to understand that this link is weak and not sufficient for survival in the long run.
For pure-play consulting firms, where the implementation is done by another vendor, or cases where the delivery team (implementation team) belongs to a different vendor because the clients’ organization has a policy of not deploying the same vendor for consulting and implementation will have to customize their model to have an in-road back into the organization to Re-assess and Optimize. Now one might ask, “Is it good to have the same vendor for both consulting and delivery?” This is a debatable topic weighing the pros and cons, but the C-D-EC model is fairly isolated from this problem. Who does it, does not matter. Is it done, is what that matters here.
If consulting and delivery is done by the same vendor, the initial homework can be done by providing the consulting arm, access to the delivery team’s repository in-house. This will give the consultants sufficient time to study what was carried out at the clients site based on their recommendations, come up with tweaks and value adds before they go back to the client to make amendments to their earlier proposed recommendations and make it stronger and better. A by-product of this effort is that the consultants now have an opportunity to build better frameworks and processes around their existing frameworks. This can then be put forward to clients who are yet to undergo an optimization or consolidation exercise.
C-D-EC (Consulting – Delivery – Extended Consulting/Collaboration) model
The consulting models followed by various organizations across the globe when mapped to a six-sigma methodology would indicate that it only address a portion of the methodology. When the delivery team takes over and completes the implementation, we can say that 80% of the six-sigma methodology is addressed.
C-D-EC model is based on the lines of six-sigma and addresses the complete DMAIC methodology end-to-end. The engagement starts with the consulting phase (Define-Measure-Analyze) to understand and define the client’s problem, walk-through the client’s existing landscape, measure (quantify) the bottle-necks, and finally analyze the findings by base-lining each identified parameter that is in focus. End of this consulting phase would be the typical recommendations, governance structure, best practices and implementation roadmap.
When the delivery team takes over and completes the implementation based on the proposed recommendations, we can say that the Improve phase of the six-sigma methodology is addressed.
What we have seen till now is what is being followed in the Industry as of today. The Control phase of the six-sigma methodology is either left out completely or addressed in parts through a maintenance and support program. The problem with addressing the control phase through maintenance, and support is that, it takes time to realize the complete benefit of the investment made. Consultants have no way to figure out how effective their recommendation was. For example, the support team can take anywhere between two to five months to just stabilize and familiarize themselves with the environment. This is because the development team normally does not end up as the support team also. Hence, on an average it can take anywhere between four to five months for the support team to figure out possible areas for enhancement and roll it into production. Let’s have a look at how bringing the consulting team back in, post-implementation can reduce this time lag of four to five months and also create some positive impact.
Extended Consulting:
The consulting team is brought back to study the gaps in implementation, understand how the users are interacting with the new setup, collect their feedback and propose an Optimize & Sustain strategy. This could be as simple as tweaking the processes/recommendations proposed initially or bringing in a completely new perspective like a collaboration that could take the entire setup to a completely new level. Under normal circumstances, this extended consulting would lead to the formulation of a continuous, repeatable and robust framework which the client could reuse on a day-to-day basis using its internal team. This fills the missing piece in the six-sigma methodology, the Control phase.
This phase can be included as part of the existing consulting models of various organizations at a small or no cost at all to the client depending on various factors like size of the implementation, relationship with the client, knowledge leveraged, etc.
Benefits of CDEC over CD
As explained earlier, the overall benefit of this model is the ability to Re-assess and re-align the roadmap in large deals, especially roadmaps which are for a period of two years and above. It also gives the ability to fine tune the solution proposed keeping the current market situation in mind.
On the other hand, it gives the consultants and in-road back into the client’s organization to look for new business opportunities and also sustain a long term relationship.
Framework for Extended Consulting
Now that we have brought the consulting team back in, questions like where should one start, how should we go about doing this extended consulting phase, can we follow the same methodology followed initially, etc will arise. One cannot follow the same methodology as it will become an over burden / over doing the whole thing. Hence the ideal answer would be a downplayed version of the original consulting model any vendor follows.
The primary factors, this downplayed version needs to address is given by the ACUTE methodology below.
ACUTE (Analyze, Compare and gather User feedback to Trigger Enhancement)
Analyze
The setup, post implementation is studied at a high level to check for completeness and accuracy with which the implementation has been done. This phase is purely from a technical perspective.
Compare
The details collected in the analyze phase is now compared against the recommendations given. The gaps if any are identified along with possible reasons for the same and impact of each gap identified. It would be an added advantage to interact with the development team(s) directly and get certain clarifications on these possible mismatches.
User Feedback
Key users feedback is collected on parameters like usability, productivity and user friendliness as the primary parameters. Only the actual users of the implementation will be part of this phase.
Trigger Enhancement
This is the phase where the findings from the Compare phase and feedback from users are studied and alternate solutions and/or tweaks to the earlier proposed recommendations/processes wherever required is drafted. In some cases, a re-usable framework customized for the client need can be generated and given to them which their in-house team can leverage.
Thanks to KrishnaKumar who helped me with his valuable feedback to come out with this model.