Impact on the success of data-driven initiatives.
Abstract
Organizations frequently discuss the importance of data quality and its impact on business value. Even the most sophisticated analytical models falter with outdated and unreliable data, resulting in misleading recommendations, inaccurate forecasts, suboptimal business decisions, and wasted resources.
In today’s data-driven world, organizations face information overload, often storing vast amounts of data without considering its diminishing relevance. While some clients recognize this “information overload” and exercise caution regarding what they capture, others maintain the status quo, leading to increased costs, flawed insights, low customer satisfaction, and poor performance.
“What goes into production environment, stays there.”
“As per regulations, we need to store 7 years of data. But we only flag records. Do not delete them!”
Organizations must understand that the value of data is not static; it evolves and degrades over time. This understanding is crucial for accurate analysis and effective decision-making. In fact, one dimension of quality is timeliness, which translates to the lifetime value of data or data aging. This article explores the concept of ‘data aging’ and its implications for the success of data-driven initiatives.
The four dimensions of data
To calculate the lifetime validity of data, one must understand the four dimensions of data, commonly referred to as the 4V’s: Volume (Vo), Velocity (Ve), Variety (Va), and Veracity (Vr). The first three—Volume, Velocity, and Variety—are straightforward.
| Dimension | Description |
|---|---|
| Volume (Vo) | The sheer amount/quantity of data from various sources. E.g., transactions, logs. |
| Velocity (Ve) | The speed at which data is generated and processed. Also known as the rate of data flow. E.g., real-time, batch. |
| Variety (Va) | The diverse forms/types of data. E.g., structured, semi-structured, and unstructured data. |
| Veracity (Vr) | The reliability and trustworthiness of data. E.g., accuracy, consistency, conformity. |
Let’s focus on the fourth V, Veracity (Vr) which encompasses the accuracy and truthfulness aspects of data. Veracity is a function of four components that directly influence the insights and Business Value (Bv) generated.
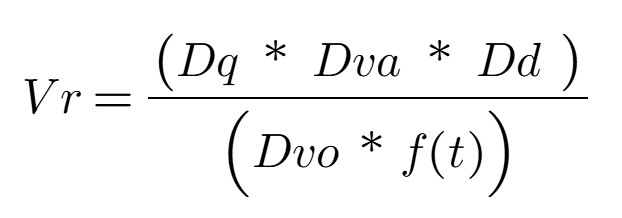
This equation represents a more traditional view and emphasizes the fundamental aspects of data veracity: data quality, data value, data density, data volatility, and the impact of time. This equation is suitable for situations where the dataset is small and data volume, velocity, and variety are relatively stable or not significant factors. In short, the focus is on the intrinsic quality and reliability of the data.
The components explained:
- Quality of Data (Dq): A normalized quantitative score, derived from a comprehensive data profiling process, serves as a measure of data quality (Dq). This score encapsulates the 4Cs: completeness, correctness, clarity, and consistency.
- Data Volatility (Dvo): Refers to the duration for which the data or dataset remains relevant. It quantifies the spread and variability of data points, extending beyond mere temporal change. While some define volatility as the rate of data change, this definition emphasizes the overall fluctuation, i.e., rate at which data changes[1]. For example, customer preferences. A numerical scale, such as 1 to 10, can be used to represent the spectrum from low to high volatility.
- Data Value (Dva): Represents the actionable insights, cost savings, or value of derived knowledge obtained through analytical modeling, such as correlation and regression. In essence, it answers the question, “What is the practical significance of this data analysis?” A numerical scale, such as 1 to 10, can be used to represent the range from low to high data value.
- Quality of Data Density (Dd): Measures the concentration of valuable, complete, and relevant information within a dataset. It emphasizes the presence of meaningful data, rather than sheer volume. For example, a dataset with numerous entries but missing essential fields exhibits low data density quality. This assessment is determined through a combination of data profiling and subject matter expert (SME) evaluation.
Computing the lifetime value using Vr
All the above components are time-dependent, and any equation involving time will have an associated lifetime or value. Hence, the value of data either remains constant (for a period) or degrades over time, depending on the type of data. Now, let us integrate the 3Vs (Volume, Velocity and Variety) into this equation (Vr).

To briefly explain, data quality, value, and density are in the numerator because high values for these components improve data reliability. The other components negatively impact trustworthiness with higher values and are therefore in the denominator. To tailor the equation to specific use cases, weight coefficients can be incorporated to reflect the relative importance of each factor. These weights should be adjusted based on the unique context or requirements of the analysis. Generally, a lower overall score indicates that the data is aged, exhibits reduced stability, and/or possesses diminished reliability. This characteristic can be particularly valuable in scenarios where historical trends and patterns hold greater significance than contemporary data, such as retrospective studies or long-term trend analyses.
Real-world examples
Consider customer purchasing behavior data. Companies utilize segmentation and personalization based on customer lifecycle stages for targeted marketing. As individuals transition through life stages, their purchasing patterns evolve. Consequently, relying on data from a specific historical point—such as during a period of job searching, financial dependence, or early adulthood—to predict purchasing behavior during a later stage of financial independence, high-income employment, family life, or mid-adulthood is likely to produce inaccurate results.
Similarly, credit rating information demonstrates the impact of data aging. Financial institutions typically prioritize a customer’s recent credit history for risk assessment. A credit rating from an individual’s early adulthood is irrelevant for risk calculations in their mid-40s. These examples underscore the principle of data aging and its implications for analytical accuracy.
Strategies for mitigating the effects of data aging
- Data Governance: Establishing clear data retention and data quality standards.
- Data Versioning (by customer stages): Tracking changes to data over time to understand its evolution.
- AI Infusion: Utilizing AI at every stage of the data lifecycle to identify and address data anomalies, inconsistencies and data decay.
Conclusion
The truth is, data isn’t static. It’s a living, breathing entity that changes over time. Recognizing and adapting to these changes is what separates effective data strategies from those that quickly become obsolete. If you found this post insightful, please comment below! In a future post, I will explore the impact of other components like data gravity and data visualization on business value. Let me know if that’s something you’d like to see!
Reference:
- “The Importance of Data Quality in a Data-Driven World” by Gartner (2023)
- “Data Decay: Why Your Data Isn’t as Good as You Think It Is” by Forbes (2022)
- McKinsey & Company, “The Age of Analytics: Competing in a Data-Driven World” (2023)
- Deloitte Insights, “Data Valuation: Understanding the Value of Your Data Assets” (2022)
- Equation created using https://www.imatheq.com/imatheq/com/imatheq/math-equation-editor.html
[1] “rate of change of data” is typically represented as a derivative in mathematics. It gives a precise value showing how one variable changes in relation to another (e.g., how temperature changes with time). “rate at which data changes” emphasizes the speed or pace at which the data is changing over time (pace of data variation).
Categories: Consulting
Tags: 4Vs, consulting, data, data aging, data-driven, framework, validity
Comments: No Comments.